GladstoneInvestment GAINL full analysis,charts,indicators,moving averages,SMA,DMA,EMA,ADX,MACD,RSIGladstone Investment GAINL WideScreen charts, DMA,SMA,EMA technical analysis, forecast prediction, by indicators ADX,MACD,RSI,CCI NASDAQ stock exchange
operates under N A sector & deals in N A
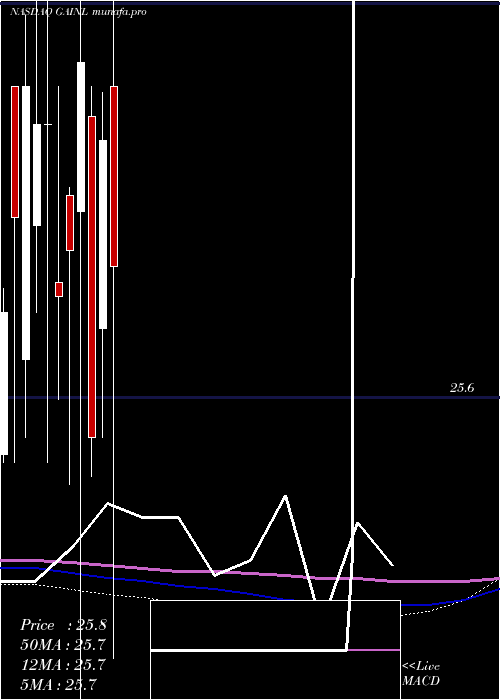
Daily price and charts and targets GladstoneInvestment Strong Daily Stock price targets for GladstoneInvestment GAINL are 25.65 and 25.92 | Daily Target 1 | 25.57 | | Daily Target 2 | 25.73 | | Daily Target 3 | 25.84 | | Daily Target 4 | 26 | | Daily Target 5 | 26.11 |
Daily price and volume Gladstone Investment
| Date |
Closing |
Open |
Range |
Volume |
Fri 31 October 2025 |
25.89 (0.74%) |
25.95 |
25.68 - 25.95 |
2.508 times |
Thu 30 October 2025 |
25.70 (0.47%) |
25.80 |
25.60 - 25.80 |
1.6077 times |
Wed 29 October 2025 |
25.58 (-0.08%) |
25.60 |
25.58 - 25.60 |
1.3505 times |
Tue 28 October 2025 |
25.60 (-0.58%) |
25.70 |
25.38 - 25.71 |
0.836 times |
Mon 27 October 2025 |
25.75 (0.08%) |
25.81 |
25.70 - 25.81 |
0.4823 times |
Fri 24 October 2025 |
25.73 (0.51%) |
25.56 |
25.55 - 25.83 |
0.6109 times |
Thu 23 October 2025 |
25.60 (-0.27%) |
25.78 |
25.55 - 25.78 |
1.0932 times |
Wed 22 October 2025 |
25.67 (0.47%) |
25.67 |
25.67 - 25.67 |
0.0965 times |
Tue 21 October 2025 |
25.55 (0.08%) |
25.58 |
25.55 - 25.61 |
0.3859 times |
Mon 20 October 2025 |
25.53 (0.39%) |
25.48 |
25.48 - 25.64 |
1.0289 times |
Fri 17 October 2025 |
25.43 (0.04%) |
25.40 |
25.40 - 25.47 |
1.0289 times |
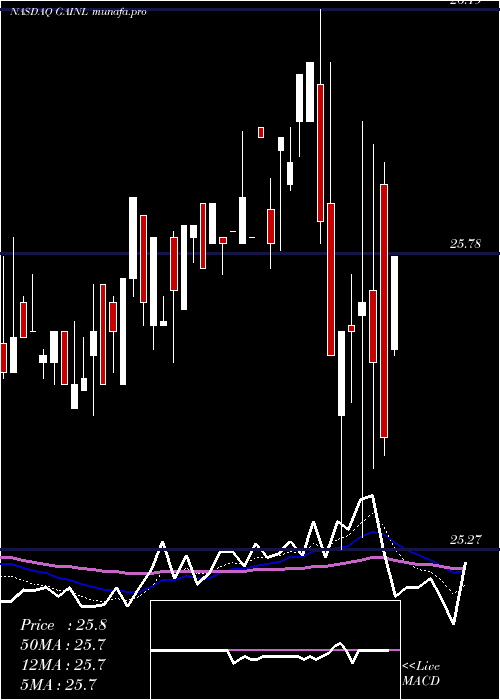
Weekly price and charts GladstoneInvestment Strong weekly Stock price targets for GladstoneInvestment GAINL are 25.64 and 26.21 | Weekly Target 1 | 25.17 | | Weekly Target 2 | 25.53 | | Weekly Target 3 | 25.74 | | Weekly Target 4 | 26.1 | | Weekly Target 5 | 26.31 |
Weekly price and volumes for Gladstone Investment
| Date |
Closing |
Open |
Range |
Volume |
Fri 31 October 2025 |
25.89 (0.62%) |
25.81 |
25.38 - 25.95 |
1.2574 times |
Fri 24 October 2025 |
25.73 (1.18%) |
25.48 |
25.48 - 25.83 |
0.5959 times |
Fri 17 October 2025 |
25.43 (-1.55%) |
25.94 |
25.34 - 25.94 |
0.8939 times |
Fri 10 October 2025 |
25.83 (-0.08%) |
25.84 |
25.75 - 25.87 |
0.7449 times |
Fri 03 October 2025 |
25.85 (1.25%) |
25.50 |
25.50 - 25.85 |
0.8462 times |
Fri 26 September 2025 |
25.53 (-0.39%) |
25.57 |
25.46 - 25.62 |
0.8999 times |
Thu 18 September 2025 |
25.63 (-0.16%) |
25.66 |
25.50 - 25.71 |
0.9774 times |
Fri 12 September 2025 |
25.67 (0.51%) |
25.60 |
25.44 - 25.68 |
1.8236 times |
Fri 05 September 2025 |
25.54 (0.16%) |
25.45 |
25.40 - 25.59 |
1.5852 times |
Fri 29 August 2025 |
25.50 (0%) |
25.46 |
25.44 - 25.54 |
0.3754 times |
Fri 29 August 2025 |
25.50 (0.35%) |
25.43 |
25.41 - 25.54 |
1.2277 times |

Monthly price and charts GladstoneInvestment Strong monthly Stock price targets for GladstoneInvestment GAINL are 25.62 and 26.23 | Monthly Target 1 | 25.12 | | Monthly Target 2 | 25.5 | | Monthly Target 3 | 25.726666666667 | | Monthly Target 4 | 26.11 | | Monthly Target 5 | 26.34 |
Monthly price and volumes Gladstone Investment
| Date |
Closing |
Open |
Range |
Volume |
Fri 31 October 2025 |
25.89 (0.9%) |
25.66 |
25.34 - 25.95 |
0.8815 times |
Tue 30 September 2025 |
25.66 (0.63%) |
25.45 |
25.40 - 25.71 |
1.3087 times |
Fri 29 August 2025 |
25.50 (0.2%) |
25.52 |
25.28 - 25.65 |
1.3032 times |
Thu 31 July 2025 |
25.45 (-0.51%) |
25.55 |
25.44 - 25.89 |
0.7437 times |
Mon 30 June 2025 |
25.58 (-0.54%) |
25.63 |
25.41 - 25.83 |
0.7581 times |
Fri 30 May 2025 |
25.72 (1.14%) |
25.37 |
25.32 - 25.90 |
0.4882 times |
Wed 30 April 2025 |
25.43 (-1.93%) |
26.00 |
25.27 - 26.19 |
1.2706 times |
Mon 31 March 2025 |
25.93 (1.49%) |
25.69 |
25.55 - 25.99 |
0.8921 times |
Fri 28 February 2025 |
25.55 (-1.84%) |
25.96 |
25.50 - 26.00 |
1.0171 times |
Fri 31 January 2025 |
26.03 (0.93%) |
25.84 |
25.10 - 26.12 |
1.3368 times |
Tue 31 December 2024 |
25.79 (0.23%) |
25.86 |
25.49 - 25.87 |
1.1222 times |
DMA SMA EMA moving averages of Gladstone Investment GAINL
DMA (daily moving average) of Gladstone Investment GAINL
| DMA period | DMA value | | 5 day DMA | 25.7 | | 12 day DMA | 25.62 | | 20 day DMA | 25.68 | | 35 day DMA | 25.66 | | 50 day DMA | 25.61 | | 100 day DMA | 25.59 | | 150 day DMA | 25.59 | | 200 day DMA | 25.63 | EMA (exponential moving average) of Gladstone Investment GAINL
| EMA period | EMA current | EMA prev | EMA prev2 | | 5 day EMA | 25.73 | 25.65 | 25.63 | | 12 day EMA | 25.68 | 25.64 | 25.63 | | 20 day EMA | 25.66 | 25.64 | 25.63 | | 35 day EMA | 25.64 | 25.63 | 25.63 | | 50 day EMA | 25.6 | 25.59 | 25.59 |
SMA (simple moving average) of Gladstone Investment GAINL
| SMA period | SMA current | SMA prev | SMA prev2 | | 5 day SMA | 25.7 | 25.67 | 25.65 | | 12 day SMA | 25.62 | 25.58 | 25.59 | | 20 day SMA | 25.68 | 25.67 | 25.68 | | 35 day SMA | 25.66 | 25.65 | 25.64 | | 50 day SMA | 25.61 | 25.6 | 25.59 | | 100 day SMA | 25.59 | 25.58 | 25.58 | | 150 day SMA | 25.59 | 25.59 | 25.59 | | 200 day SMA | 25.63 | 25.63 | 25.64 |
|
|
