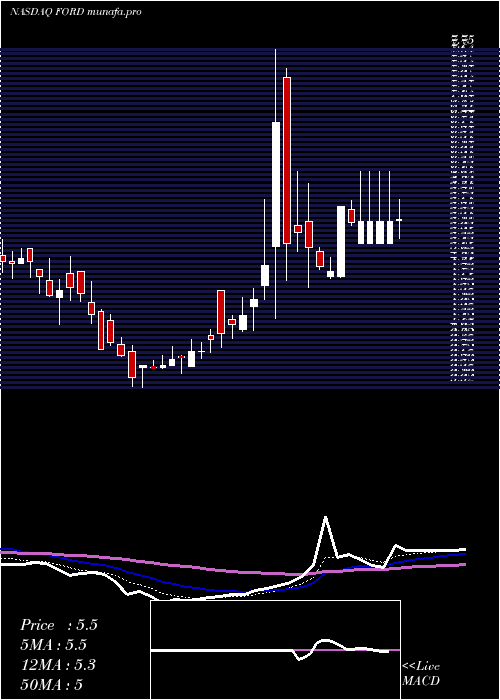
ForwardIndustries FORD full analysis,charts,indicators,moving averages,SMA,DMA,EMA,ADX,MACD,RSIForward Industries FORD WideScreen charts, DMA,SMA,EMA technical analysis, forecast prediction, by indicators ADX,MACD,RSI,CCI NASDAQ stock exchange
operates under Consumer Non Durables sector & deals in Plastic Products
Daily price and charts and targets ForwardIndustries Strong Daily Stock price targets for ForwardIndustries FORD are 14.2 and 15.7 | Daily Target 1 | 13.14 | | Daily Target 2 | 13.76 | | Daily Target 3 | 14.636666666667 | | Daily Target 4 | 15.26 | | Daily Target 5 | 16.14 |
Daily price and volume Forward Industries
| Date |
Closing |
Open |
Range |
Volume |
Fri 31 October 2025 |
14.39 (0.21%) |
14.26 |
14.01 - 15.51 |
1.1278 times |
Thu 30 October 2025 |
14.36 (-0.28%) |
14.05 |
13.51 - 14.99 |
1.0608 times |
Wed 29 October 2025 |
14.40 (-9.09%) |
15.92 |
14.11 - 15.92 |
1.1103 times |
Tue 28 October 2025 |
15.84 (-6.66%) |
16.72 |
15.43 - 17.00 |
1.0266 times |
Mon 27 October 2025 |
16.97 (2.35%) |
17.28 |
15.84 - 17.41 |
0.9719 times |
Fri 24 October 2025 |
16.58 (-6.96%) |
18.12 |
15.60 - 18.12 |
1.3096 times |
Thu 23 October 2025 |
17.82 (-2.46%) |
18.53 |
16.45 - 19.00 |
0.9069 times |
Wed 22 October 2025 |
18.27 (-2.09%) |
17.67 |
16.83 - 18.53 |
0.6733 times |
Tue 21 October 2025 |
18.66 (-8.26%) |
20.01 |
18.20 - 20.11 |
0.6961 times |
Mon 20 October 2025 |
20.34 (-6.48%) |
22.01 |
19.65 - 22.97 |
1.1166 times |
Fri 17 October 2025 |
21.75 (-0.41%) |
22.00 |
20.83 - 22.97 |
0.7129 times |
Weekly price and charts ForwardIndustries Strong weekly Stock price targets for ForwardIndustries FORD are 12 and 15.9 | Weekly Target 1 | 11.2 | | Weekly Target 2 | 12.8 | | Weekly Target 3 | 15.103333333333 | | Weekly Target 4 | 16.7 | | Weekly Target 5 | 19 |
Weekly price and volumes for Forward Industries
| Date |
Closing |
Open |
Range |
Volume |
Fri 31 October 2025 |
14.39 (-13.21%) |
17.28 |
13.51 - 17.41 |
1.162 times |
Fri 24 October 2025 |
16.58 (-23.77%) |
22.01 |
15.60 - 22.97 |
1.0315 times |
Fri 17 October 2025 |
21.75 (6.67%) |
23.00 |
20.83 - 25.50 |
0.8418 times |
Fri 10 October 2025 |
20.39 (-10.96%) |
22.48 |
20.22 - 26.65 |
1.1618 times |
Fri 03 October 2025 |
22.90 (-21.66%) |
30.00 |
22.30 - 30.32 |
0.8841 times |
Fri 26 September 2025 |
29.23 (-4.01%) |
29.12 |
27.00 - 33.00 |
0.8575 times |
Fri 19 September 2025 |
30.45 (-15.65%) |
34.26 |
29.60 - 43.50 |
1.2796 times |
Fri 12 September 2025 |
36.10 (120.8%) |
30.50 |
20.60 - 46.00 |
2.6098 times |
Fri 05 September 2025 |
16.35 (7.42%) |
15.11 |
13.02 - 16.72 |
0.1505 times |
Fri 29 August 2025 |
15.22 (0%) |
14.26 |
14.05 - 15.29 |
0.0215 times |
Fri 29 August 2025 |
15.22 (44.27%) |
10.62 |
10.55 - 15.29 |
0.1017 times |

Monthly price and charts ForwardIndustries Strong monthly Stock price targets for ForwardIndustries FORD are 6.58 and 21.32 | Monthly Target 1 | 3.98 | | Monthly Target 2 | 9.18 | | Monthly Target 3 | 18.716666666667 | | Monthly Target 4 | 23.92 | | Monthly Target 5 | 33.46 |
Monthly price and volumes Forward Industries
| Date |
Closing |
Open |
Range |
Volume |
Fri 31 October 2025 |
14.39 (-43.72%) |
26.10 |
13.51 - 28.25 |
3.9188 times |
Tue 30 September 2025 |
25.57 (68%) |
15.11 |
13.02 - 46.00 |
4.4015 times |
Fri 29 August 2025 |
15.22 (25.68%) |
12.18 |
9.57 - 15.50 |
0.351 times |
Thu 31 July 2025 |
12.11 (107.36%) |
6.14 |
6.00 - 12.60 |
0.2459 times |
Mon 30 June 2025 |
5.84 (-8.32%) |
6.25 |
5.69 - 7.44 |
0.0807 times |
Fri 30 May 2025 |
6.37 (-5.63%) |
6.93 |
6.35 - 8.97 |
0.1443 times |
Wed 30 April 2025 |
6.75 (62.65%) |
4.09 |
4.06 - 7.75 |
0.5361 times |
Mon 31 March 2025 |
4.15 (-13.18%) |
4.73 |
3.32 - 5.04 |
0.1124 times |
Fri 28 February 2025 |
4.78 (-20.47%) |
6.68 |
4.55 - 6.99 |
0.0778 times |
Fri 31 January 2025 |
6.01 (21.41%) |
4.89 |
4.68 - 6.99 |
0.1315 times |
Tue 31 December 2024 |
4.95 (21.62%) |
4.30 |
4.11 - 5.55 |
0.123 times |

DMA SMA EMA moving averages of Forward Industries FORD
DMA (daily moving average) of Forward Industries FORD
| DMA period | DMA value | | 5 day DMA | 15.19 | | 12 day DMA | 17.6 | | 20 day DMA | 20.11 | | 35 day DMA | 24.3 | | 50 day DMA | 22.82 | | 100 day DMA | 16.14 | | 150 day DMA | 12.91 | | 200 day DMA | 10.96 | EMA (exponential moving average) of Forward Industries FORD
| EMA period | EMA current | EMA prev | EMA prev2 | | 5 day EMA | 15.22 | 15.63 | 16.27 | | 12 day EMA | 17.41 | 17.96 | 18.61 | | 20 day EMA | 19.16 | 19.66 | 20.22 | | 35 day EMA | 20.11 | 20.45 | 20.81 | | 50 day EMA | 21.08 | 21.35 | 21.63 |
SMA (simple moving average) of Forward Industries FORD
| SMA period | SMA current | SMA prev | SMA prev2 | | 5 day SMA | 15.19 | 15.63 | 16.32 | | 12 day SMA | 17.6 | 18.43 | 19.26 | | 20 day SMA | 20.11 | 20.53 | 21.03 | | 35 day SMA | 24.3 | 24.92 | 25.49 | | 50 day SMA | 22.82 | 22.75 | 22.67 | | 100 day SMA | 16.14 | 16.06 | 15.98 | | 150 day SMA | 12.91 | 12.84 | 12.77 | | 200 day SMA | 10.96 | 10.91 | 10.87 |
|
|
