FirstLong FLIC full analysis,charts,indicators,moving averages,SMA,DMA,EMA,ADX,MACD,RSIFirst Long FLIC WideScreen charts, DMA,SMA,EMA technical analysis, forecast prediction, by indicators ADX,MACD,RSI,CCI NASDAQ stock exchange
operates under Finance sector & deals in Major Banks
Daily price and charts and targets FirstLong Strong Daily Stock price targets for FirstLong FLIC are 11.68 and 11.85 | Daily Target 1 | 11.62 | | Daily Target 2 | 11.73 | | Daily Target 3 | 11.79 | | Daily Target 4 | 11.9 | | Daily Target 5 | 11.96 |
Daily price and volume First Long
| Date |
Closing |
Open |
Range |
Volume |
Thu 29 May 2025 |
11.84 (0.25%) |
11.85 |
11.68 - 11.85 |
0.9222 times |
Wed 28 May 2025 |
11.81 (-1.25%) |
11.97 |
11.79 - 12.04 |
0.9855 times |
Tue 27 May 2025 |
11.96 (1.44%) |
11.95 |
11.83 - 12.01 |
1.1784 times |
Fri 23 May 2025 |
11.79 (0.86%) |
11.39 |
11.39 - 11.83 |
1.0669 times |
Thu 22 May 2025 |
11.69 (-1.27%) |
11.74 |
11.68 - 11.99 |
0.9825 times |
Wed 21 May 2025 |
11.84 (-3.9%) |
12.11 |
11.83 - 12.20 |
0.8981 times |
Tue 20 May 2025 |
12.32 (-0.4%) |
12.40 |
12.31 - 12.43 |
0.9011 times |
Mon 19 May 2025 |
12.37 (-0.08%) |
12.25 |
12.18 - 12.38 |
0.8137 times |
Fri 16 May 2025 |
12.38 (-2.37%) |
12.65 |
12.37 - 12.65 |
1.5672 times |
Thu 15 May 2025 |
12.68 (0.88%) |
12.57 |
12.56 - 12.70 |
0.6841 times |
Wed 14 May 2025 |
12.57 (-1.26%) |
12.65 |
12.57 - 12.69 |
1.0398 times |
Weekly price and charts FirstLong Strong weekly Stock price targets for FirstLong FLIC are 11.58 and 11.94 | Weekly Target 1 | 11.49 | | Weekly Target 2 | 11.67 | | Weekly Target 3 | 11.853333333333 | | Weekly Target 4 | 12.03 | | Weekly Target 5 | 12.21 |
Weekly price and volumes for First Long
| Date |
Closing |
Open |
Range |
Volume |
Thu 29 May 2025 |
11.84 (0.42%) |
11.95 |
11.68 - 12.04 |
0.6193 times |
Fri 23 May 2025 |
11.79 (-4.77%) |
12.25 |
11.39 - 12.43 |
0.9356 times |
Fri 16 May 2025 |
12.38 (0.32%) |
12.80 |
12.37 - 12.98 |
1.5664 times |
Fri 09 May 2025 |
12.34 (1.73%) |
12.02 |
11.92 - 12.53 |
1.8452 times |
Fri 02 May 2025 |
12.13 (5.85%) |
11.50 |
11.36 - 12.18 |
2.3654 times |
Fri 25 April 2025 |
11.46 (4.47%) |
10.75 |
10.75 - 11.65 |
1.3717 times |
Thu 17 April 2025 |
10.97 (0.92%) |
10.86 |
10.75 - 11.07 |
0.3107 times |
Wed 16 April 2025 |
10.87 (0%) |
10.86 |
10.75 - 10.97 |
0 times |
Wed 16 April 2025 |
10.87 (0%) |
10.86 |
10.75 - 10.97 |
0.2199 times |
Wed 16 April 2025 |
10.87 (2.35%) |
10.74 |
10.55 - 11.14 |
0.7657 times |
Fri 11 April 2025 |
10.62 (-3.45%) |
11.13 |
10.45 - 11.85 |
2.9472 times |

Monthly price and charts FirstLong Strong monthly Stock price targets for FirstLong FLIC are 11.62 and 13.21 | Monthly Target 1 | 10.48 | | Monthly Target 2 | 11.16 | | Monthly Target 3 | 12.07 | | Monthly Target 4 | 12.75 | | Monthly Target 5 | 13.66 |
Monthly price and volumes First Long
| Date |
Closing |
Open |
Range |
Volume |
Thu 29 May 2025 |
11.84 (2.78%) |
11.40 |
11.39 - 12.98 |
0.5753 times |
Wed 30 April 2025 |
11.52 (-6.72%) |
12.60 |
10.45 - 12.60 |
0.7557 times |
Mon 31 March 2025 |
12.35 (-6.23%) |
13.26 |
11.56 - 13.28 |
0.8133 times |
Fri 28 February 2025 |
13.17 (1.31%) |
12.67 |
12.38 - 14.19 |
0.8995 times |
Fri 31 January 2025 |
13.00 (11.3%) |
11.78 |
10.85 - 13.21 |
1.0324 times |
Tue 31 December 2024 |
11.68 (-20.65%) |
14.21 |
11.61 - 14.34 |
0.8553 times |
Tue 26 November 2024 |
14.72 (17.01%) |
12.64 |
12.33 - 15.03 |
1.0759 times |
Thu 31 October 2024 |
12.58 (-2.25%) |
12.81 |
12.32 - 13.91 |
1.2668 times |
Mon 30 September 2024 |
12.87 (0.78%) |
12.62 |
12.13 - 13.64 |
1.8363 times |
Fri 30 August 2024 |
12.77 (-2.67%) |
13.05 |
11.35 - 13.17 |
0.8895 times |
Wed 31 July 2024 |
13.12 (30.94%) |
10.06 |
9.90 - 13.60 |
1.6236 times |

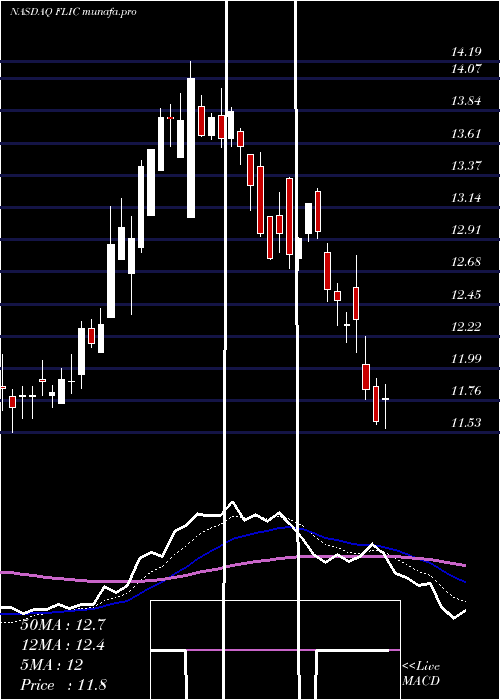
DMA SMA EMA moving averages of First Long FLIC
DMA (daily moving average) of First Long FLIC
| DMA period | DMA value | | 5 day DMA | 11.82 | | 12 day DMA | 12.17 | | 20 day DMA | 12.16 | | 35 day DMA | 11.72 | | 50 day DMA | 11.74 | | 100 day DMA | 12.13 | | 150 day DMA | 12.5 | | 200 day DMA | 12.53 | EMA (exponential moving average) of First Long FLIC
| EMA period | EMA current | EMA prev | EMA prev2 | | 5 day EMA | 11.89 | 11.91 | 11.96 | | 12 day EMA | 12 | 12.03 | 12.07 | | 20 day EMA | 11.98 | 12 | 12.02 | | 35 day EMA | 11.92 | 11.93 | 11.94 | | 50 day EMA | 11.76 | 11.76 | 11.76 |
SMA (simple moving average) of First Long FLIC
| SMA period | SMA current | SMA prev | SMA prev2 | | 5 day SMA | 11.82 | 11.82 | 11.92 | | 12 day SMA | 12.17 | 12.24 | 12.28 | | 20 day SMA | 12.16 | 12.15 | 12.14 | | 35 day SMA | 11.72 | 11.69 | 11.68 | | 50 day SMA | 11.74 | 11.75 | 11.75 | | 100 day SMA | 12.13 | 12.13 | 12.13 | | 150 day SMA | 12.5 | 12.51 | 12.52 | | 200 day SMA | 12.53 | 12.53 | 12.53 |
|
|
