FaroTechnologies FARO full analysis,charts,indicators,moving averages,SMA,DMA,EMA,ADX,MACD,RSIFaro Technologies FARO WideScreen charts, DMA,SMA,EMA technical analysis, forecast prediction, by indicators ADX,MACD,RSI,CCI NASDAQ stock exchange
operates under Capital Goods sector & deals in Industrial Machinery Components
Daily price and charts and targets FaroTechnologies Strong Daily Stock price targets for FaroTechnologies FARO are 43.91 and 43.97 | Daily Target 1 | 43.87 | | Daily Target 2 | 43.89 | | Daily Target 3 | 43.926666666667 | | Daily Target 4 | 43.95 | | Daily Target 5 | 43.99 |
Daily price and volume Faro Technologies
| Date |
Closing |
Open |
Range |
Volume |
Mon 14 July 2025 |
43.92 (-0.05%) |
43.91 |
43.90 - 43.96 |
0.6513 times |
Fri 11 July 2025 |
43.94 (0.07%) |
43.94 |
43.91 - 43.99 |
0.7808 times |
Thu 10 July 2025 |
43.91 (0.02%) |
43.96 |
43.90 - 43.96 |
1.143 times |
Wed 09 July 2025 |
43.90 (0.02%) |
44.00 |
43.90 - 44.03 |
0.9652 times |
Tue 08 July 2025 |
43.89 (-0.05%) |
43.93 |
43.89 - 44.06 |
1.6684 times |
Mon 07 July 2025 |
43.91 (-0.02%) |
43.88 |
43.88 - 43.97 |
1.0767 times |
Thu 03 July 2025 |
43.92 (0%) |
43.96 |
43.87 - 43.96 |
0.3742 times |
Wed 02 July 2025 |
43.92 (0%) |
43.92 |
43.85 - 43.97 |
0.9407 times |
Tue 01 July 2025 |
43.92 (0%) |
43.88 |
43.88 - 43.98 |
1.1126 times |
Mon 30 June 2025 |
43.92 (-0.16%) |
43.94 |
43.86 - 43.94 |
1.2872 times |
Fri 27 June 2025 |
43.99 (0.39%) |
43.85 |
43.82 - 44.03 |
1.1958 times |
Weekly price and charts FaroTechnologies Strong weekly Stock price targets for FaroTechnologies FARO are 43.91 and 43.97 | Weekly Target 1 | 43.87 | | Weekly Target 2 | 43.89 | | Weekly Target 3 | 43.926666666667 | | Weekly Target 4 | 43.95 | | Weekly Target 5 | 43.99 |
Weekly price and volumes for Faro Technologies
| Date |
Closing |
Open |
Range |
Volume |
Mon 14 July 2025 |
43.92 (-0.05%) |
43.91 |
43.90 - 43.96 |
0.1394 times |
Fri 11 July 2025 |
43.94 (0.05%) |
43.88 |
43.88 - 44.06 |
1.2059 times |
Thu 03 July 2025 |
43.92 (-0.16%) |
43.94 |
43.85 - 43.98 |
0.7951 times |
Fri 27 June 2025 |
43.99 (0.62%) |
43.76 |
43.72 - 44.03 |
1.012 times |
Fri 20 June 2025 |
43.72 (2.89%) |
43.73 |
43.72 - 43.86 |
0.9747 times |
Fri 13 June 2025 |
42.49 (0.17%) |
42.46 |
42.33 - 42.80 |
1.0817 times |
Fri 06 June 2025 |
42.42 (0.12%) |
42.27 |
42.27 - 42.59 |
0.9465 times |
Fri 30 May 2025 |
42.37 (0.88%) |
42.20 |
42.04 - 42.58 |
0.8926 times |
Fri 23 May 2025 |
42.00 (-0.66%) |
42.21 |
41.96 - 42.28 |
1.1235 times |
Fri 16 May 2025 |
42.28 (-0.07%) |
42.60 |
42.06 - 42.64 |
1.8286 times |
Fri 09 May 2025 |
42.31 (37.33%) |
30.32 |
30.27 - 42.50 |
6.1653 times |
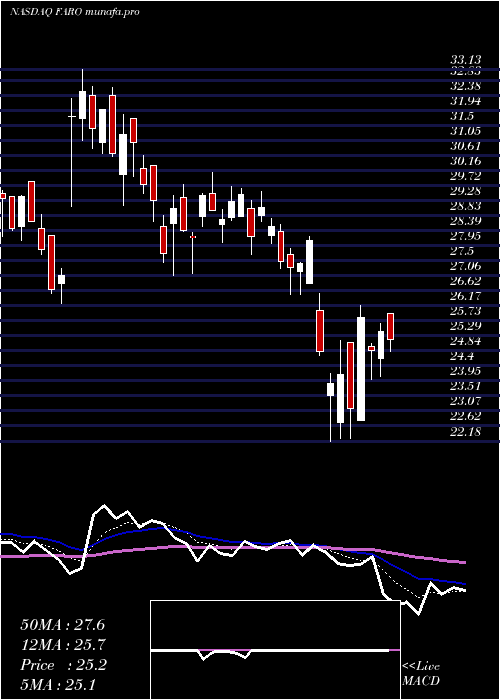
Monthly price and charts FaroTechnologies Strong monthly Stock price targets for FaroTechnologies FARO are 43.89 and 44.1 | Monthly Target 1 | 43.73 | | Monthly Target 2 | 43.83 | | Monthly Target 3 | 43.943333333333 | | Monthly Target 4 | 44.04 | | Monthly Target 5 | 44.15 |
Monthly price and volumes Faro Technologies
| Date |
Closing |
Open |
Range |
Volume |
Mon 14 July 2025 |
43.92 (0%) |
43.88 |
43.85 - 44.06 |
0.7015 times |
Mon 30 June 2025 |
43.92 (3.66%) |
42.27 |
42.27 - 44.03 |
1.614 times |
Fri 30 May 2025 |
42.37 (44.07%) |
29.44 |
29.42 - 42.64 |
3.8346 times |
Wed 30 April 2025 |
29.41 (7.73%) |
27.19 |
22.18 - 31.76 |
0.7281 times |
Mon 31 March 2025 |
27.30 (-14.58%) |
32.38 |
26.50 - 32.60 |
0.6344 times |
Fri 28 February 2025 |
31.96 (0.76%) |
30.44 |
26.25 - 33.13 |
0.6376 times |
Fri 31 January 2025 |
31.72 (25.08%) |
25.69 |
24.21 - 32.90 |
0.7201 times |
Tue 31 December 2024 |
25.36 (-3.94%) |
26.78 |
24.69 - 29.29 |
0.3459 times |
Tue 26 November 2024 |
26.40 (50.51%) |
17.62 |
17.42 - 28.04 |
0.5117 times |
Thu 31 October 2024 |
17.54 (-8.36%) |
19.15 |
17.43 - 19.15 |
0.2721 times |
Mon 30 September 2024 |
19.14 (6.33%) |
17.86 |
16.10 - 19.32 |
0.4611 times |
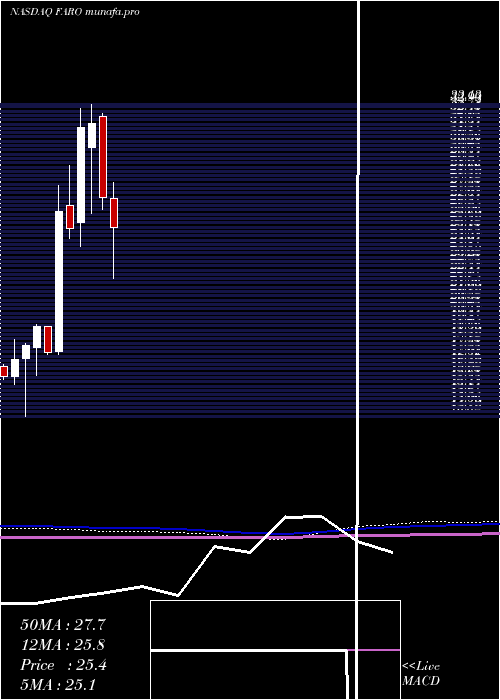
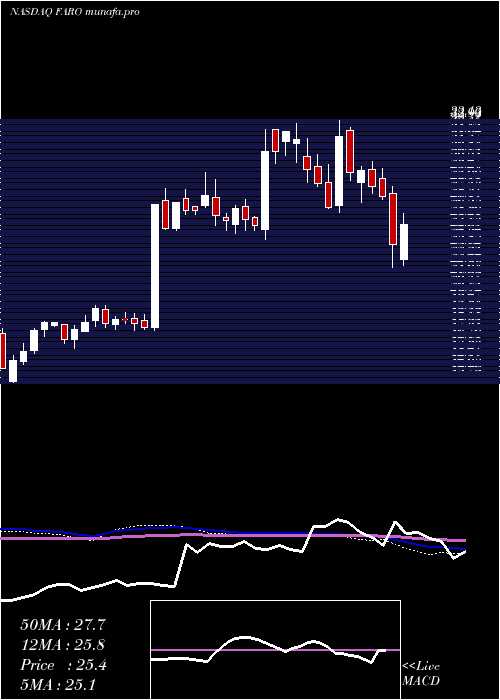
DMA SMA EMA moving averages of Faro Technologies FARO
DMA (daily moving average) of Faro Technologies FARO
| DMA period | DMA value | | 5 day DMA | 43.91 | | 12 day DMA | 43.91 | | 20 day DMA | 43.73 | | 35 day DMA | 43.13 | | 50 day DMA | 41.91 | | 100 day DMA | 34.82 | | 150 day DMA | 32.69 | | 200 day DMA | 29.63 | EMA (exponential moving average) of Faro Technologies FARO
| EMA period | EMA current | EMA prev | EMA prev2 | | 5 day EMA | 43.91 | 43.91 | 43.9 | | 12 day EMA | 43.82 | 43.8 | 43.78 | | 20 day EMA | 43.48 | 43.43 | 43.38 | | 35 day EMA | 42.3 | 42.2 | 42.1 | | 50 day EMA | 41.09 | 40.97 | 40.85 |
SMA (simple moving average) of Faro Technologies FARO
| SMA period | SMA current | SMA prev | SMA prev2 | | 5 day SMA | 43.91 | 43.91 | 43.91 | | 12 day SMA | 43.91 | 43.9 | 43.89 | | 20 day SMA | 43.73 | 43.66 | 43.59 | | 35 day SMA | 43.13 | 43.08 | 43.03 | | 50 day SMA | 41.91 | 41.63 | 41.36 | | 100 day SMA | 34.82 | 34.67 | 34.52 | | 150 day SMA | 32.69 | 32.57 | 32.46 | | 200 day SMA | 29.63 | 29.5 | 29.37 |
|
|
