89bioInc ETNB full analysis,charts,indicators,moving averages,SMA,DMA,EMA,ADX,MACD,RSI89bio Inc ETNB WideScreen charts, DMA,SMA,EMA technical analysis, forecast prediction, by indicators ADX,MACD,RSI,CCI NASDAQ stock exchange
Daily price and charts and targets 89bioInc Strong Daily Stock price targets for 89bioInc ETNB are 8 and 8.55 | Daily Target 1 | 7.61 | | Daily Target 2 | 7.84 | | Daily Target 3 | 8.1566666666667 | | Daily Target 4 | 8.39 | | Daily Target 5 | 8.71 |
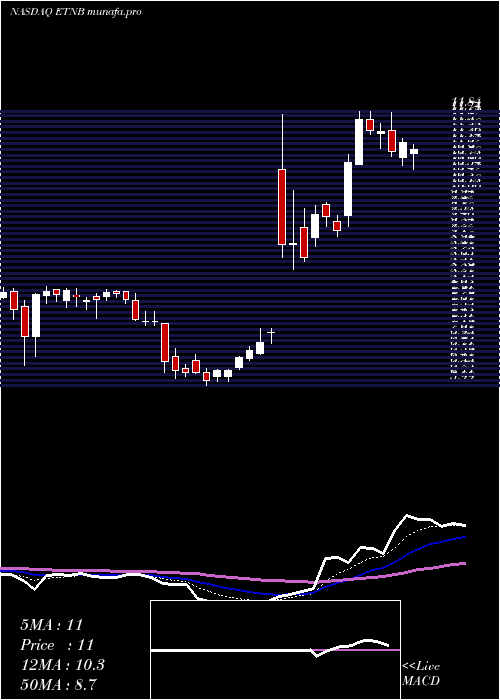
Daily price and volume 89bio Inc
| Date |
Closing |
Open |
Range |
Volume |
Wed 17 September 2025 |
8.08 (1.38%) |
8.02 |
7.92 - 8.47 |
1.2279 times |
Tue 16 September 2025 |
7.97 (-0.62%) |
8.01 |
7.88 - 8.11 |
0.7655 times |
Mon 15 September 2025 |
8.02 (-0.62%) |
8.11 |
7.84 - 8.19 |
0.7196 times |
Fri 12 September 2025 |
8.07 (-6.71%) |
8.62 |
8.06 - 8.64 |
0.5795 times |
Thu 11 September 2025 |
8.65 (1.53%) |
8.53 |
8.48 - 8.71 |
0.7625 times |
Wed 10 September 2025 |
8.52 (-1.27%) |
8.64 |
8.33 - 8.73 |
1.5372 times |
Tue 09 September 2025 |
8.63 (0.7%) |
8.62 |
8.44 - 8.77 |
0.6805 times |
Mon 08 September 2025 |
8.57 (-3.38%) |
8.90 |
8.45 - 8.90 |
0.9047 times |
Fri 05 September 2025 |
8.87 (3.02%) |
8.62 |
8.49 - 8.95 |
1.5553 times |
Thu 04 September 2025 |
8.61 (-6.82%) |
9.36 |
8.46 - 9.47 |
1.2674 times |
Wed 03 September 2025 |
9.24 (0.54%) |
9.20 |
9.10 - 9.44 |
0.7085 times |
Weekly price and charts 89bioInc Strong weekly Stock price targets for 89bioInc ETNB are 7.65 and 8.28 | Weekly Target 1 | 7.5 | | Weekly Target 2 | 7.79 | | Weekly Target 3 | 8.13 | | Weekly Target 4 | 8.42 | | Weekly Target 5 | 8.76 |
Weekly price and volumes for 89bio Inc
| Date |
Closing |
Open |
Range |
Volume |
Wed 17 September 2025 |
8.08 (0.12%) |
8.11 |
7.84 - 8.47 |
0.5376 times |
Fri 12 September 2025 |
8.07 (-9.02%) |
8.90 |
8.06 - 8.90 |
0.8846 times |
Fri 05 September 2025 |
8.87 (-1.77%) |
9.12 |
8.46 - 9.48 |
0.9668 times |
Fri 29 August 2025 |
9.03 (0%) |
9.42 |
8.96 - 9.58 |
0.4948 times |
Fri 29 August 2025 |
9.03 (-4.24%) |
9.46 |
8.96 - 9.62 |
1.4388 times |
Fri 22 August 2025 |
9.43 (2.17%) |
9.26 |
8.82 - 9.70 |
0.8359 times |
Fri 15 August 2025 |
9.23 (0.65%) |
9.16 |
8.52 - 9.50 |
1.2887 times |
Fri 08 August 2025 |
9.17 (0.11%) |
9.39 |
8.42 - 10.32 |
1.4394 times |
Fri 01 August 2025 |
9.16 (-4.48%) |
9.68 |
9.02 - 9.85 |
1.077 times |
Fri 25 July 2025 |
9.59 (-8.58%) |
10.49 |
9.52 - 10.61 |
1.0364 times |
Fri 18 July 2025 |
10.49 (-4.64%) |
10.99 |
10.29 - 11.41 |
0.9293 times |

Monthly price and charts 89bioInc Strong monthly Stock price targets for 89bioInc ETNB are 7.14 and 8.78 | Monthly Target 1 | 6.83 | | Monthly Target 2 | 7.45 | | Monthly Target 3 | 8.4666666666667 | | Monthly Target 4 | 9.09 | | Monthly Target 5 | 10.11 |
Monthly price and volumes 89bio Inc
| Date |
Closing |
Open |
Range |
Volume |
Wed 17 September 2025 |
8.08 (-10.52%) |
9.12 |
7.84 - 9.48 |
0.4037 times |
Fri 29 August 2025 |
9.03 (-4.95%) |
9.32 |
8.42 - 10.32 |
0.9589 times |
Thu 31 July 2025 |
9.50 (-3.26%) |
9.70 |
9.12 - 11.41 |
0.8165 times |
Mon 30 June 2025 |
9.82 (-0.2%) |
9.90 |
9.21 - 10.70 |
1.1927 times |
Fri 30 May 2025 |
9.84 (22.69%) |
8.00 |
7.37 - 10.30 |
1.17 times |
Wed 30 April 2025 |
8.02 (10.32%) |
7.12 |
4.16 - 8.08 |
1.0233 times |
Mon 31 March 2025 |
7.27 (-21.24%) |
9.19 |
6.88 - 9.40 |
1.0449 times |
Fri 28 February 2025 |
9.23 (-3.85%) |
9.48 |
8.50 - 11.84 |
0.9865 times |
Fri 31 January 2025 |
9.60 (22.76%) |
7.90 |
5.99 - 11.77 |
1.8539 times |
Tue 31 December 2024 |
7.82 (-12.13%) |
8.44 |
6.43 - 8.50 |
0.5496 times |
Tue 26 November 2024 |
8.90 (14.4%) |
7.82 |
7.67 - 10.72 |
0.5595 times |

DMA SMA EMA moving averages of 89bio Inc ETNB
DMA (daily moving average) of 89bio Inc ETNB
| DMA period | DMA value | | 5 day DMA | 8.16 | | 12 day DMA | 8.54 | | 20 day DMA | 8.82 | | 35 day DMA | 8.99 | | 50 day DMA | 9.38 | | 100 day DMA | 9.26 | | 150 day DMA | 8.8 | | 200 day DMA | 8.65 | EMA (exponential moving average) of 89bio Inc ETNB
| EMA period | EMA current | EMA prev | EMA prev2 | | 5 day EMA | 8.16 | 8.2 | 8.32 | | 12 day EMA | 8.44 | 8.51 | 8.61 | | 20 day EMA | 8.69 | 8.75 | 8.83 | | 35 day EMA | 9.01 | 9.07 | 9.14 | | 50 day EMA | 9.3 | 9.35 | 9.41 |
SMA (simple moving average) of 89bio Inc ETNB
| SMA period | SMA current | SMA prev | SMA prev2 | | 5 day SMA | 8.16 | 8.25 | 8.38 | | 12 day SMA | 8.54 | 8.61 | 8.7 | | 20 day SMA | 8.82 | 8.87 | 8.92 | | 35 day SMA | 8.99 | 9.02 | 9.07 | | 50 day SMA | 9.38 | 9.42 | 9.46 | | 100 day SMA | 9.26 | 9.24 | 9.23 | | 150 day SMA | 8.8 | 8.82 | 8.84 | | 200 day SMA | 8.65 | 8.65 | 8.65 |
|
|
