CurevacN CVAC full analysis,charts,indicators,moving averages,SMA,DMA,EMA,ADX,MACD,RSICurevac N CVAC WideScreen charts, DMA,SMA,EMA technical analysis, forecast prediction, by indicators ADX,MACD,RSI,CCI NASDAQ stock exchange
Daily price and charts and targets CurevacN Strong Daily Stock price targets for CurevacN CVAC are 4.12 and 4.23 | Daily Target 1 | 4.03 | | Daily Target 2 | 4.1 | | Daily Target 3 | 4.1433333333333 | | Daily Target 4 | 4.21 | | Daily Target 5 | 4.25 |
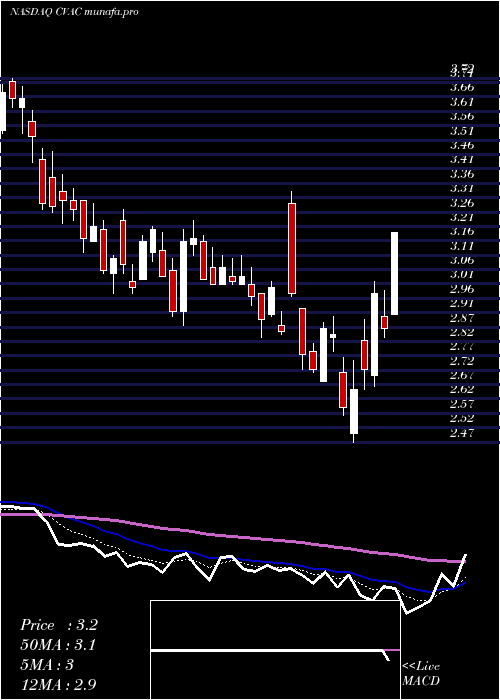
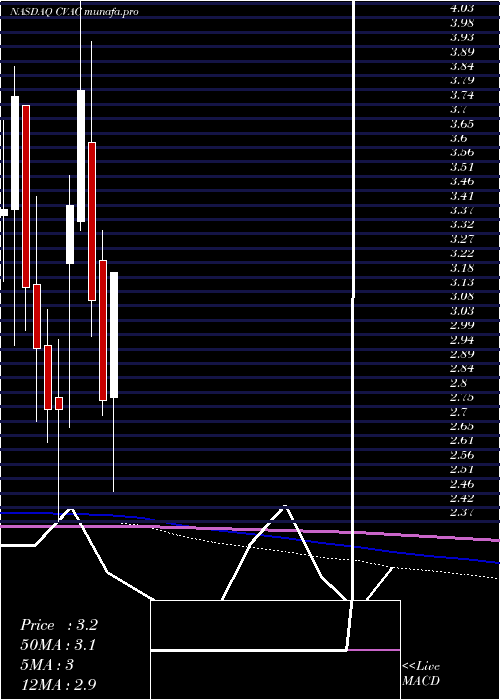
Daily price and volume Curevac N
| Date |
Closing |
Open |
Range |
Volume |
Fri 19 December 2025 |
4.16 (-2.8%) |
4.15 |
4.08 - 4.19 |
2.2209 times |
Thu 18 December 2025 |
4.28 (3.63%) |
4.15 |
4.07 - 4.31 |
1.0652 times |
Wed 17 December 2025 |
4.13 (-14.32%) |
4.66 |
4.13 - 4.66 |
1.2801 times |
Tue 16 December 2025 |
4.82 (-3.6%) |
4.97 |
4.77 - 4.98 |
1.3799 times |
Mon 15 December 2025 |
5.00 (-0.99%) |
5.04 |
4.98 - 5.06 |
1.1009 times |
Fri 12 December 2025 |
5.05 (-1.37%) |
5.12 |
5.05 - 5.16 |
0.5124 times |
Thu 11 December 2025 |
5.12 (0.2%) |
5.12 |
5.10 - 5.20 |
0.4029 times |
Wed 10 December 2025 |
5.11 (-0.2%) |
5.12 |
5.05 - 5.14 |
0.4401 times |
Tue 09 December 2025 |
5.12 (-1.73%) |
5.16 |
5.11 - 5.21 |
0.8579 times |
Mon 08 December 2025 |
5.21 (1.76%) |
5.20 |
5.17 - 5.31 |
0.7396 times |
Fri 05 December 2025 |
5.12 (0%) |
5.12 |
5.10 - 5.16 |
0.3225 times |
Weekly price and charts CurevacN Strong weekly Stock price targets for CurevacN CVAC are 3.62 and 4.61 | Weekly Target 1 | 3.44 | | Weekly Target 2 | 3.8 | | Weekly Target 3 | 4.43 | | Weekly Target 4 | 4.79 | | Weekly Target 5 | 5.42 |
Weekly price and volumes for Curevac N
| Date |
Closing |
Open |
Range |
Volume |
Fri 19 December 2025 |
4.16 (-17.62%) |
5.04 |
4.07 - 5.06 |
1.6785 times |
Fri 12 December 2025 |
5.05 (-1.37%) |
5.20 |
5.05 - 5.31 |
0.7033 times |
Fri 05 December 2025 |
5.12 (-6.74%) |
5.37 |
5.10 - 5.43 |
2.0177 times |
Fri 28 November 2025 |
5.49 (9.15%) |
5.00 |
4.95 - 5.55 |
2.5551 times |
Fri 21 November 2025 |
5.03 (-4.73%) |
5.28 |
5.01 - 5.31 |
0.9185 times |
Fri 14 November 2025 |
5.28 (1.34%) |
5.21 |
5.19 - 5.39 |
0.6559 times |
Fri 07 November 2025 |
5.21 (-2.43%) |
5.31 |
5.17 - 5.33 |
0.5032 times |
Fri 31 October 2025 |
5.34 (0%) |
5.36 |
5.34 - 5.36 |
0.1111 times |
Fri 31 October 2025 |
5.34 (-0.37%) |
5.37 |
5.33 - 5.38 |
0.5235 times |
Fri 24 October 2025 |
5.36 (0%) |
5.36 |
5.34 - 5.41 |
0.3333 times |
Fri 17 October 2025 |
5.36 (-0.37%) |
5.37 |
5.34 - 5.41 |
0.4425 times |

Monthly price and charts CurevacN Strong monthly Stock price targets for CurevacN CVAC are 3.44 and 4.8 | Monthly Target 1 | 3.19 | | Monthly Target 2 | 3.68 | | Monthly Target 3 | 4.5533333333333 | | Monthly Target 4 | 5.04 | | Monthly Target 5 | 5.91 |
Monthly price and volumes Curevac N
| Date |
Closing |
Open |
Range |
Volume |
Fri 19 December 2025 |
4.16 (-24.23%) |
5.37 |
4.07 - 5.43 |
1.2767 times |
Fri 28 November 2025 |
5.49 (2.81%) |
5.31 |
4.95 - 5.55 |
1.3444 times |
Fri 31 October 2025 |
5.34 (-0.93%) |
5.39 |
5.33 - 5.45 |
0.6013 times |
Tue 30 September 2025 |
5.39 (0.37%) |
5.35 |
5.32 - 5.41 |
0.4786 times |
Fri 29 August 2025 |
5.37 (-0.37%) |
5.38 |
5.36 - 5.54 |
0.7146 times |
Thu 31 July 2025 |
5.39 (-0.74%) |
5.37 |
5.35 - 5.51 |
1.0604 times |
Mon 30 June 2025 |
5.43 (21.48%) |
4.66 |
4.07 - 5.72 |
2.2895 times |
Fri 30 May 2025 |
4.47 (25.92%) |
3.60 |
3.26 - 4.80 |
0.8795 times |
Wed 30 April 2025 |
3.55 (28.16%) |
2.78 |
2.47 - 3.76 |
0.6739 times |
Mon 31 March 2025 |
2.77 (-10.65%) |
3.23 |
2.72 - 3.33 |
0.6811 times |
Fri 28 February 2025 |
3.10 (-18.21%) |
3.62 |
2.98 - 3.95 |
0.6962 times |
DMA SMA EMA moving averages of Curevac N CVAC
DMA (daily moving average) of Curevac N CVAC
| DMA period | DMA value | | 5 day DMA | 4.48 | | 12 day DMA | 4.85 | | 20 day DMA | 5.01 | | 35 day DMA | 5.12 | | 50 day DMA | 5.19 | | 100 day DMA | 5.3 | | 150 day DMA | 5.21 | | 200 day DMA | 4.69 | EMA (exponential moving average) of Curevac N CVAC
| EMA period | EMA current | EMA prev | EMA prev2 | | 5 day EMA | 4.43 | 4.56 | 4.7 | | 12 day EMA | 4.73 | 4.83 | 4.93 | | 20 day EMA | 4.89 | 4.97 | 5.04 | | 35 day EMA | 5.05 | 5.1 | 5.15 | | 50 day EMA | 5.14 | 5.18 | 5.22 |
SMA (simple moving average) of Curevac N CVAC
| SMA period | SMA current | SMA prev | SMA prev2 | | 5 day SMA | 4.48 | 4.66 | 4.82 | | 12 day SMA | 4.85 | 4.94 | 5.01 | | 20 day SMA | 5.01 | 5.05 | 5.1 | | 35 day SMA | 5.12 | 5.15 | 5.18 | | 50 day SMA | 5.19 | 5.22 | 5.24 | | 100 day SMA | 5.3 | 5.31 | 5.32 | | 150 day SMA | 5.21 | 5.2 | 5.2 | | 200 day SMA | 4.69 | 4.69 | 4.68 |
|
|
