ChimerixInc CMRX full analysis,charts,indicators,moving averages,SMA,DMA,EMA,ADX,MACD,RSIChimerix Inc CMRX WideScreen charts, DMA,SMA,EMA technical analysis, forecast prediction, by indicators ADX,MACD,RSI,CCI NASDAQ stock exchange
operates under Health Care sector & deals in Major Pharmaceuticals
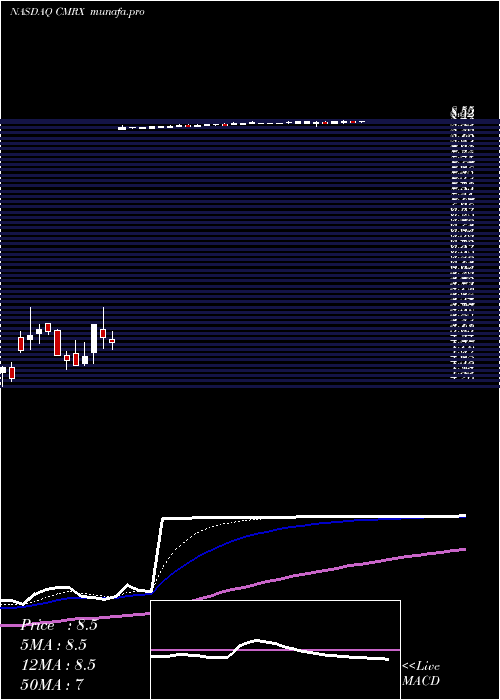
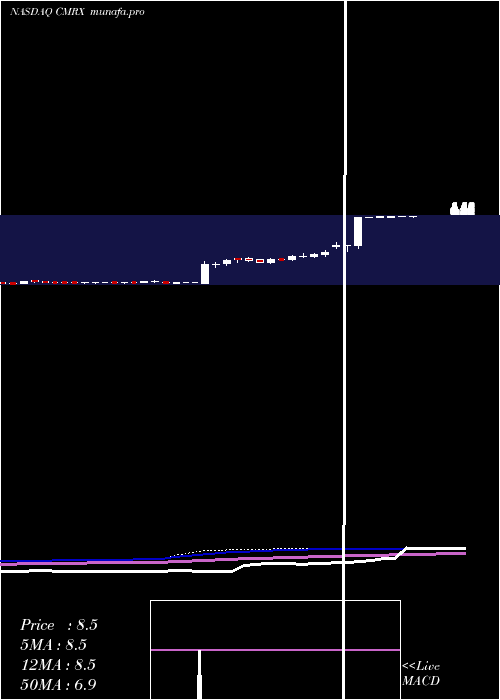
Daily price and charts and targets ChimerixInc Strong Daily Stock price targets for ChimerixInc CMRX are 8.52 and 8.53 | Daily Target 1 | 8.51 | | Daily Target 2 | 8.52 | | Daily Target 3 | 8.5233333333333 | | Daily Target 4 | 8.53 | | Daily Target 5 | 8.53 |
Daily price and volume Chimerix Inc
| Date |
Closing |
Open |
Range |
Volume |
Fri 11 April 2025 |
8.52 (-0.12%) |
8.53 |
8.52 - 8.53 |
0.6232 times |
Thu 10 April 2025 |
8.53 (0%) |
8.52 |
8.51 - 8.55 |
1.1979 times |
Wed 09 April 2025 |
8.53 (0.24%) |
8.51 |
8.50 - 8.53 |
1.6954 times |
Tue 08 April 2025 |
8.51 (-0.12%) |
8.52 |
8.51 - 8.54 |
0.4726 times |
Mon 07 April 2025 |
8.52 (-0.12%) |
8.50 |
8.46 - 8.53 |
1.721 times |
Fri 04 April 2025 |
8.53 (0%) |
8.51 |
8.51 - 8.54 |
1.8432 times |
Thu 03 April 2025 |
8.53 (0.12%) |
8.51 |
8.51 - 8.53 |
0.4107 times |
Wed 02 April 2025 |
8.52 (0.24%) |
8.52 |
8.51 - 8.53 |
0.5462 times |
Tue 01 April 2025 |
8.50 (-0.12%) |
8.50 |
8.50 - 8.51 |
0.7081 times |
Mon 31 March 2025 |
8.51 (0.12%) |
8.50 |
8.50 - 8.51 |
0.7816 times |
Fri 28 March 2025 |
8.50 (-0.23%) |
8.50 |
8.50 - 8.51 |
0.3387 times |
Weekly price and charts ChimerixInc Strong weekly Stock price targets for ChimerixInc CMRX are 8.49 and 8.58 | Weekly Target 1 | 8.42 | | Weekly Target 2 | 8.47 | | Weekly Target 3 | 8.51 | | Weekly Target 4 | 8.56 | | Weekly Target 5 | 8.6 |
Weekly price and volumes for Chimerix Inc
| Date |
Closing |
Open |
Range |
Volume |
Fri 11 April 2025 |
8.52 (-0.12%) |
8.50 |
8.46 - 8.55 |
0.6088 times |
Fri 04 April 2025 |
8.53 (0.35%) |
8.50 |
8.50 - 8.54 |
0.4573 times |
Fri 28 March 2025 |
8.50 (0%) |
8.49 |
8.49 - 8.53 |
0.1641 times |
Fri 21 March 2025 |
8.50 (0.47%) |
8.46 |
8.46 - 8.52 |
0.4213 times |
Fri 14 March 2025 |
8.46 (0.36%) |
8.42 |
8.42 - 8.48 |
0.6055 times |
Fri 07 March 2025 |
8.43 (60.57%) |
5.17 |
4.86 - 8.47 |
6.1679 times |
Fri 28 February 2025 |
5.25 (1.94%) |
5.16 |
4.53 - 5.25 |
0.3584 times |
Fri 21 February 2025 |
5.15 (17.58%) |
5.05 |
4.80 - 5.53 |
0.5522 times |
Fri 14 February 2025 |
4.38 (4.04%) |
4.21 |
3.94 - 4.65 |
0.3208 times |
Fri 07 February 2025 |
4.21 (6.85%) |
3.87 |
3.78 - 4.30 |
0.3438 times |
Fri 31 January 2025 |
3.94 (-0.51%) |
3.90 |
3.83 - 4.22 |
0.2469 times |
Monthly price and charts ChimerixInc Strong monthly Stock price targets for ChimerixInc CMRX are 8.49 and 8.58 | Monthly Target 1 | 8.42 | | Monthly Target 2 | 8.47 | | Monthly Target 3 | 8.51 | | Monthly Target 4 | 8.56 | | Monthly Target 5 | 8.6 |
Monthly price and volumes Chimerix Inc
| Date |
Closing |
Open |
Range |
Volume |
Fri 11 April 2025 |
8.52 (0.12%) |
8.50 |
8.46 - 8.55 |
0.4276 times |
Mon 31 March 2025 |
8.51 (62.1%) |
5.17 |
4.86 - 8.53 |
3.2381 times |
Fri 28 February 2025 |
5.25 (33.25%) |
3.87 |
3.78 - 5.53 |
0.6854 times |
Fri 31 January 2025 |
3.94 (13.22%) |
3.51 |
3.12 - 4.22 |
0.5702 times |
Tue 31 December 2024 |
3.48 (286.67%) |
0.84 |
0.82 - 3.66 |
4.368 times |
Tue 26 November 2024 |
0.90 (-7.22%) |
0.97 |
0.83 - 1.12 |
0.0996 times |
Thu 31 October 2024 |
0.97 (4.3%) |
0.94 |
0.80 - 1.00 |
0.0558 times |
Mon 30 September 2024 |
0.93 (0%) |
0.95 |
0.81 - 0.95 |
0.0694 times |
Fri 30 August 2024 |
0.93 (4.49%) |
0.89 |
0.75 - 1.19 |
0.3977 times |
Wed 31 July 2024 |
0.89 (1.14%) |
0.89 |
0.78 - 0.98 |
0.0882 times |
Fri 28 June 2024 |
0.88 (-9.28%) |
0.98 |
0.87 - 0.98 |
0.0949 times |

DMA SMA EMA moving averages of Chimerix Inc CMRX
DMA (daily moving average) of Chimerix Inc CMRX
| DMA period | DMA value | | 5 day DMA | 8.52 | | 12 day DMA | 8.52 | | 20 day DMA | 8.5 | | 35 day DMA | 7.57 | | 50 day DMA | 6.58 | | 100 day DMA | 4.58 | | 150 day DMA | 3.35 | | 200 day DMA | 2.74 | EMA (exponential moving average) of Chimerix Inc CMRX
| EMA period | EMA current | EMA prev | EMA prev2 | | 5 day EMA | 8.52 | 8.52 | 8.52 | | 12 day EMA | 8.47 | 8.46 | 8.45 | | 20 day EMA | 8.22 | 8.19 | 8.15 | | 35 day EMA | 7.43 | 7.37 | 7.3 | | 50 day EMA | 6.55 | 6.47 | 6.39 |
SMA (simple moving average) of Chimerix Inc CMRX
| SMA period | SMA current | SMA prev | SMA prev2 | | 5 day SMA | 8.52 | 8.52 | 8.52 | | 12 day SMA | 8.52 | 8.52 | 8.51 | | 20 day SMA | 8.5 | 8.5 | 8.5 | | 35 day SMA | 7.57 | 7.47 | 7.37 | | 50 day SMA | 6.58 | 6.49 | 6.4 | | 100 day SMA | 4.58 | 4.51 | 4.43 | | 150 day SMA | 3.35 | 3.3 | 3.25 | | 200 day SMA | 2.74 | 2.7 | 2.66 |
|
|
