CrossfirstBankshares CFB full analysis,charts,indicators,moving averages,SMA,DMA,EMA,ADX,MACD,RSICrossfirst Bankshares CFB WideScreen charts, DMA,SMA,EMA technical analysis, forecast prediction, by indicators ADX,MACD,RSI,CCI NASDAQ stock exchange
Daily price and charts and targets CrossfirstBankshares Strong Daily Stock price targets for CrossfirstBankshares CFB are 14.46 and 14.81 | Daily Target 1 | 14.18 | | Daily Target 2 | 14.39 | | Daily Target 3 | 14.526666666667 | | Daily Target 4 | 14.74 | | Daily Target 5 | 14.88 |
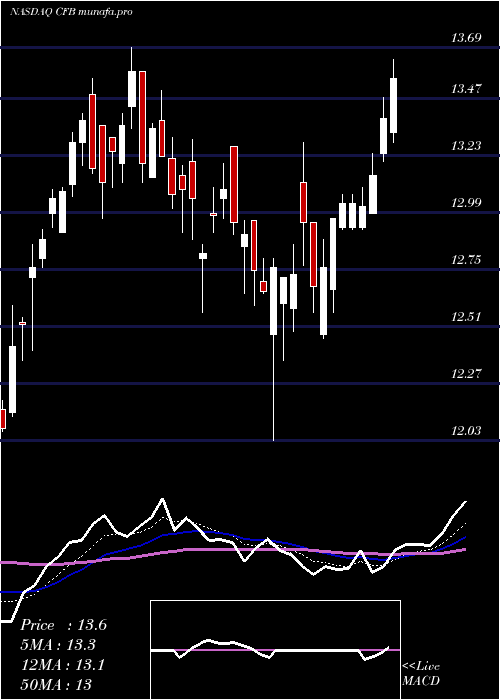
Daily price and volume Crossfirst Bankshares
| Date |
Closing |
Open |
Range |
Volume |
Tue 14 January 2025 |
14.61 (2.67%) |
14.36 |
14.31 - 14.66 |
0.9781 times |
Mon 13 January 2025 |
14.23 (0.85%) |
13.99 |
13.99 - 14.27 |
0.8725 times |
Fri 10 January 2025 |
14.11 (-3.62%) |
14.35 |
13.98 - 14.48 |
1.0713 times |
Wed 08 January 2025 |
14.64 (0%) |
14.52 |
14.46 - 14.76 |
2.0936 times |
Wed 08 January 2025 |
14.64 (-0.2%) |
14.52 |
14.46 - 14.76 |
2.0936 times |
Tue 07 January 2025 |
14.67 (-2%) |
14.97 |
14.58 - 15.17 |
0.6096 times |
Mon 06 January 2025 |
14.97 (0%) |
14.97 |
14.72 - 15.34 |
0.592 times |
Fri 03 January 2025 |
14.97 (0.94%) |
14.92 |
14.60 - 15.01 |
0.5572 times |
Thu 02 January 2025 |
14.83 (-2.11%) |
15.24 |
14.75 - 15.32 |
0.6549 times |
Tue 31 December 2024 |
15.15 (-0.46%) |
15.33 |
15.12 - 15.35 |
0.4774 times |
Mon 30 December 2024 |
15.22 (-0.59%) |
15.24 |
15.14 - 15.38 |
0.3852 times |
Weekly price and charts CrossfirstBankshares Strong weekly Stock price targets for CrossfirstBankshares CFB are 14.3 and 14.97 | Weekly Target 1 | 13.75 | | Weekly Target 2 | 14.18 | | Weekly Target 3 | 14.42 | | Weekly Target 4 | 14.85 | | Weekly Target 5 | 15.09 |
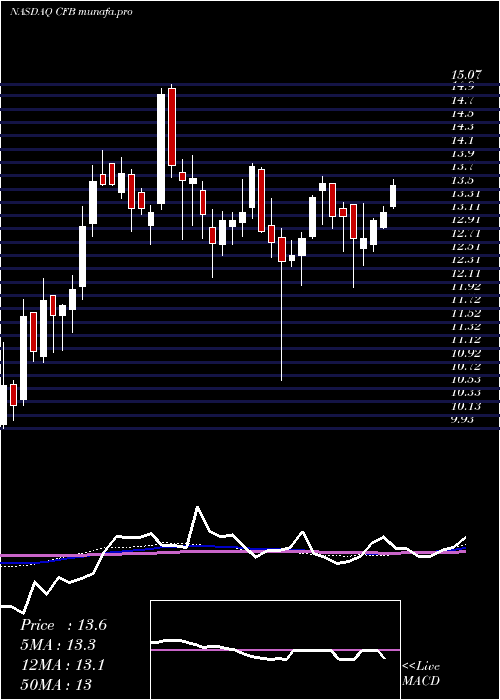
Weekly price and volumes for Crossfirst Bankshares
| Date |
Closing |
Open |
Range |
Volume |
Tue 14 January 2025 |
14.61 (3.54%) |
13.99 |
13.99 - 14.66 |
0.6427 times |
Fri 10 January 2025 |
14.11 (-3.62%) |
14.52 |
13.98 - 14.76 |
1.0991 times |
Wed 08 January 2025 |
14.64 (-2.2%) |
14.97 |
14.46 - 15.34 |
1.1444 times |
Fri 03 January 2025 |
14.97 (-2.22%) |
15.24 |
14.60 - 15.38 |
0.7205 times |
Fri 27 December 2024 |
15.31 (-1.35%) |
15.45 |
15.20 - 15.80 |
0.6072 times |
Fri 20 December 2024 |
15.52 (-8.22%) |
16.93 |
15.27 - 17.14 |
1.8572 times |
Fri 13 December 2024 |
16.91 (-4.08%) |
17.44 |
16.76 - 17.60 |
1.5271 times |
Tue 26 November 2024 |
17.63 (0%) |
17.77 |
16.84 - 17.90 |
0.2948 times |
Tue 26 November 2024 |
17.63 (-1.84%) |
17.90 |
16.84 - 18.55 |
0.7353 times |
Fri 22 November 2024 |
17.96 (4.85%) |
17.16 |
16.83 - 17.99 |
1.3716 times |
Fri 15 November 2024 |
17.13 (0.29%) |
17.51 |
17.02 - 17.92 |
2.0297 times |
Monthly price and charts CrossfirstBankshares Strong monthly Stock price targets for CrossfirstBankshares CFB are 13.62 and 14.98 | Monthly Target 1 | 13.28 | | Monthly Target 2 | 13.95 | | Monthly Target 3 | 14.643333333333 | | Monthly Target 4 | 15.31 | | Monthly Target 5 | 16 |
Monthly price and volumes Crossfirst Bankshares
| Date |
Closing |
Open |
Range |
Volume |
Tue 14 January 2025 |
14.61 (-3.56%) |
15.24 |
13.98 - 15.34 |
0.3888 times |
Tue 31 December 2024 |
15.15 (-14.07%) |
17.44 |
15.12 - 17.60 |
0.5045 times |
Tue 26 November 2024 |
17.63 (12.29%) |
15.86 |
15.27 - 18.55 |
0.8949 times |
Thu 31 October 2024 |
15.70 (-5.93%) |
16.57 |
15.25 - 16.98 |
1.095 times |
Mon 30 September 2024 |
16.69 (-4.08%) |
17.28 |
16.14 - 17.96 |
1.429 times |
Fri 30 August 2024 |
17.40 (-6.15%) |
18.52 |
15.41 - 18.68 |
1.4902 times |
Wed 31 July 2024 |
18.54 (32.24%) |
14.03 |
13.62 - 19.22 |
1.9059 times |
Fri 28 June 2024 |
14.02 (7.1%) |
13.27 |
12.03 - 14.22 |
0.8563 times |
Fri 31 May 2024 |
13.09 (8.36%) |
12.15 |
12.13 - 13.69 |
0.8311 times |
Tue 30 April 2024 |
12.08 (-12.72%) |
13.80 |
10.64 - 13.83 |
0.6043 times |
Thu 28 March 2024 |
13.84 (7.54%) |
12.78 |
12.51 - 13.89 |
0.4912 times |

DMA SMA EMA moving averages of Crossfirst Bankshares CFB
DMA (daily moving average) of Crossfirst Bankshares CFB
| DMA period | DMA value | | 5 day DMA | 14.45 | | 12 day DMA | 14.78 | | 20 day DMA | 15.23 | | 35 day DMA | 16.15 | | 50 day DMA | 16.25 | | 100 day DMA | 16.54 | | 150 day DMA | 16.13 | | 200 day DMA | 15.32 | EMA (exponential moving average) of Crossfirst Bankshares CFB
| EMA period | EMA current | EMA prev | EMA prev2 | | 5 day EMA | 14.5 | 14.44 | 14.55 | | 12 day EMA | 14.82 | 14.86 | 14.98 | | 20 day EMA | 15.2 | 15.26 | 15.37 | | 35 day EMA | 15.6 | 15.66 | 15.74 | | 50 day EMA | 16.06 | 16.12 | 16.2 |
SMA (simple moving average) of Crossfirst Bankshares CFB
| SMA period | SMA current | SMA prev | SMA prev2 | | 5 day SMA | 14.45 | 14.46 | 14.61 | | 12 day SMA | 14.78 | 14.87 | 14.99 | | 20 day SMA | 15.23 | 15.35 | 15.49 | | 35 day SMA | 16.15 | 16.23 | 16.32 | | 50 day SMA | 16.25 | 16.27 | 16.31 | | 100 day SMA | 16.54 | 16.56 | 16.58 | | 150 day SMA | 16.13 | 16.12 | 16.11 | | 200 day SMA | 15.32 | 15.32 | 15.31 |
|
|
