BiosigTechnologies BSGM full analysis,charts,indicators,moving averages,SMA,DMA,EMA,ADX,MACD,RSIBiosig Technologies BSGM WideScreen charts, DMA,SMA,EMA technical analysis, forecast prediction, by indicators ADX,MACD,RSI,CCI NASDAQ stock exchange
operates under Health Care sector & deals in Biotechnology Electromedical Electrotherapeutic Apparatus
Daily price and charts and targets BiosigTechnologies Strong Daily Stock price targets for BiosigTechnologies BSGM are 4.6 and 4.93 | Daily Target 1 | 4.53 | | Daily Target 2 | 4.66 | | Daily Target 3 | 4.8633333333333 | | Daily Target 4 | 4.99 | | Daily Target 5 | 5.19 |
Daily price and volume Biosig Technologies
| Date |
Closing |
Open |
Range |
Volume |
Fri 29 August 2025 |
4.78 (0%) |
5.07 |
4.74 - 5.07 |
0.5783 times |
Fri 29 August 2025 |
4.78 (-2.85%) |
5.07 |
4.74 - 5.07 |
0.5783 times |
Thu 28 August 2025 |
4.92 (2.93%) |
4.80 |
4.76 - 5.19 |
0.788 times |
Wed 27 August 2025 |
4.78 (-9.3%) |
5.27 |
4.76 - 5.35 |
0.826 times |
Tue 26 August 2025 |
5.27 (-0.57%) |
5.30 |
5.18 - 5.65 |
1.0696 times |
Mon 25 August 2025 |
5.30 (2.32%) |
5.10 |
5.10 - 5.63 |
0.9717 times |
Fri 22 August 2025 |
5.18 (3.81%) |
4.92 |
4.84 - 5.37 |
0.7793 times |
Thu 21 August 2025 |
4.99 (5.72%) |
4.65 |
4.65 - 5.13 |
1.0715 times |
Wed 20 August 2025 |
4.72 (-1.87%) |
4.88 |
4.40 - 4.93 |
0.9226 times |
Tue 19 August 2025 |
4.81 (-12.23%) |
5.40 |
4.74 - 5.59 |
2.4148 times |
Mon 18 August 2025 |
5.48 (10.26%) |
4.81 |
4.66 - 5.49 |
3.0188 times |
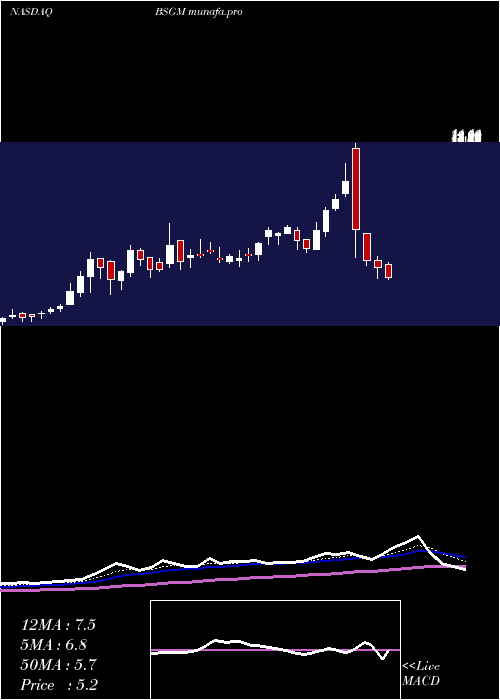
Weekly price and charts BiosigTechnologies Strong weekly Stock price targets for BiosigTechnologies BSGM are 4.6 and 4.93 | Weekly Target 1 | 4.53 | | Weekly Target 2 | 4.66 | | Weekly Target 3 | 4.8633333333333 | | Weekly Target 4 | 4.99 | | Weekly Target 5 | 5.19 |
Weekly price and volumes for Biosig Technologies
| Date |
Closing |
Open |
Range |
Volume |
Fri 29 August 2025 |
4.78 (0%) |
5.07 |
4.74 - 5.07 |
0.0732 times |
Fri 29 August 2025 |
4.78 (-7.72%) |
5.10 |
4.74 - 5.65 |
0.5362 times |
Fri 22 August 2025 |
5.18 (4.23%) |
4.81 |
4.40 - 5.59 |
1.0395 times |
Fri 15 August 2025 |
4.97 (32.53%) |
3.75 |
3.70 - 5.59 |
1.0958 times |
Fri 08 August 2025 |
3.75 (-12.59%) |
4.34 |
3.63 - 4.42 |
0.4404 times |
Fri 01 August 2025 |
4.29 (-10.44%) |
4.79 |
4.05 - 5.02 |
0.59 times |
Fri 25 July 2025 |
4.79 (3.46%) |
4.75 |
4.50 - 6.45 |
1.2841 times |
Fri 18 July 2025 |
4.63 (-11.47%) |
5.05 |
4.07 - 5.68 |
1.5457 times |
Fri 11 July 2025 |
5.23 (-49.76%) |
10.75 |
5.10 - 14.11 |
2.8255 times |
Thu 03 July 2025 |
10.41 (35.9%) |
7.71 |
6.90 - 10.73 |
0.5696 times |
Fri 27 June 2025 |
7.66 (14.33%) |
6.71 |
6.31 - 8.64 |
0.8198 times |
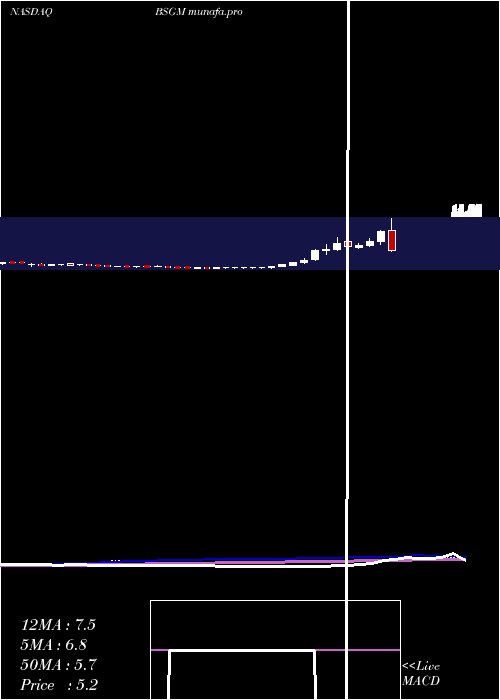
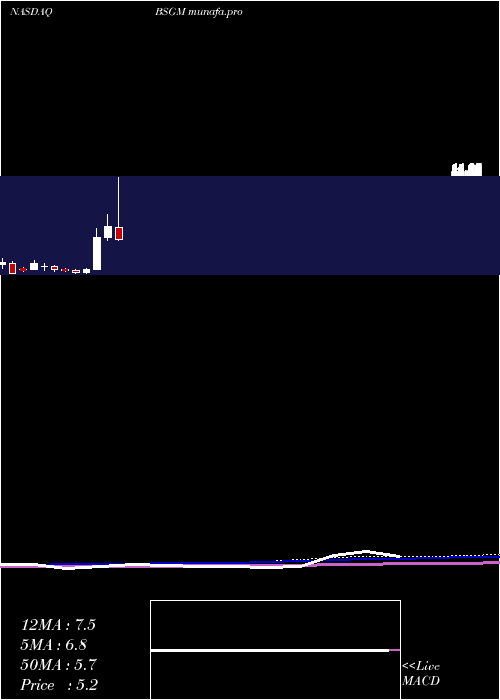
Monthly price and charts BiosigTechnologies Strong monthly Stock price targets for BiosigTechnologies BSGM are 4.21 and 6.23 | Monthly Target 1 | 2.67 | | Monthly Target 2 | 3.72 | | Monthly Target 3 | 4.6866666666667 | | Monthly Target 4 | 5.74 | | Monthly Target 5 | 6.71 |
Monthly price and volumes Biosig Technologies
| Date |
Closing |
Open |
Range |
Volume |
Fri 29 August 2025 |
4.78 (3.46%) |
4.52 |
3.63 - 5.65 |
1.3642 times |
Thu 31 July 2025 |
4.62 (-35.29%) |
7.05 |
4.07 - 14.11 |
2.7248 times |
Mon 30 June 2025 |
7.14 (27.5%) |
5.56 |
5.20 - 8.80 |
1.5204 times |
Fri 30 May 2025 |
5.60 (443.69%) |
1.04 |
1.03 - 6.84 |
1.7729 times |
Wed 30 April 2025 |
1.03 (71.67%) |
0.60 |
0.40 - 1.14 |
0.3612 times |
Mon 31 March 2025 |
0.60 (-35.48%) |
0.95 |
0.46 - 1.03 |
0.3607 times |
Fri 28 February 2025 |
0.93 (-9.71%) |
1.03 |
0.77 - 1.24 |
0.7334 times |
Fri 31 January 2025 |
1.03 (-30.87%) |
1.51 |
0.82 - 1.67 |
0.2511 times |
Tue 31 December 2024 |
1.49 (-21.99%) |
1.43 |
0.92 - 1.87 |
0.3422 times |
Tue 26 November 2024 |
1.91 (80.19%) |
1.07 |
1.04 - 2.33 |
0.5692 times |
Thu 31 October 2024 |
1.06 (125.53%) |
1.10 |
0.69 - 1.26 |
0.5209 times |
DMA SMA EMA moving averages of Biosig Technologies BSGM
DMA (daily moving average) of Biosig Technologies BSGM
| DMA period | DMA value | | 5 day DMA | 4.91 | | 12 day DMA | 5 | | 20 day DMA | 4.69 | | 35 day DMA | 4.8 | | 50 day DMA | 5.75 | | 100 day DMA | 4.43 | | 150 day DMA | 3.22 | | 200 day DMA | 2.79 | EMA (exponential moving average) of Biosig Technologies BSGM
| EMA period | EMA current | EMA prev | EMA prev2 | | 5 day EMA | 4.87 | 4.92 | 4.99 | | 12 day EMA | 4.9 | 4.92 | 4.94 | | 20 day EMA | 4.93 | 4.95 | 4.97 | | 35 day EMA | 5.32 | 5.35 | 5.38 | | 50 day EMA | 5.73 | 5.77 | 5.81 |
SMA (simple moving average) of Biosig Technologies BSGM
| SMA period | SMA current | SMA prev | SMA prev2 | | 5 day SMA | 4.91 | 5.01 | 5.09 | | 12 day SMA | 5 | 5.03 | 5.01 | | 20 day SMA | 4.69 | 4.66 | 4.65 | | 35 day SMA | 4.8 | 4.81 | 4.84 | | 50 day SMA | 5.75 | 5.79 | 5.82 | | 100 day SMA | 4.43 | 4.38 | 4.34 | | 150 day SMA | 3.22 | 3.19 | 3.17 | | 200 day SMA | 2.79 | 2.78 | 2.76 |
|
|
