BerryPetroleum BRY full analysis,charts,indicators,moving averages,SMA,DMA,EMA,ADX,MACD,RSIBerry Petroleum BRY WideScreen charts, DMA,SMA,EMA technical analysis, forecast prediction, by indicators ADX,MACD,RSI,CCI NASDAQ stock exchange
operates under Energy sector & deals in Oil Gas Production
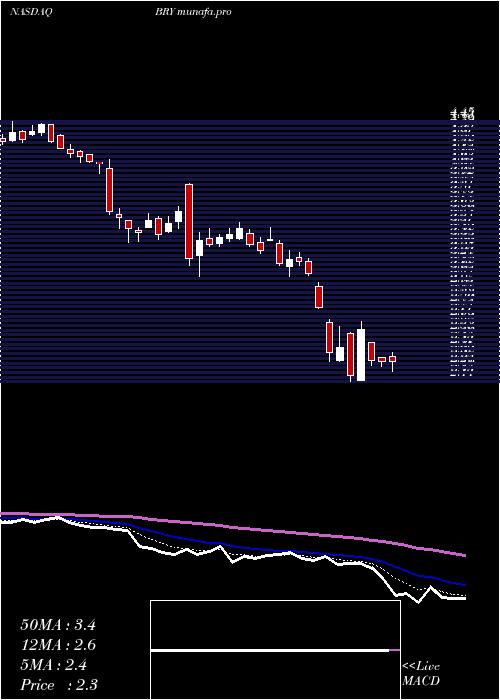
Daily price and charts and targets BerryPetroleum Strong Daily Stock price targets for BerryPetroleum BRY are 3.35 and 3.45 | Daily Target 1 | 3.27 | | Daily Target 2 | 3.32 | | Daily Target 3 | 3.37 | | Daily Target 4 | 3.42 | | Daily Target 5 | 3.47 |
Daily price and volume Berry Petroleum
| Date |
Closing |
Open |
Range |
Volume |
Fri 31 October 2025 |
3.37 (1.2%) |
3.33 |
3.32 - 3.42 |
0.9476 times |
Thu 30 October 2025 |
3.33 (0%) |
3.33 |
3.28 - 3.39 |
0.8084 times |
Wed 29 October 2025 |
3.33 (0%) |
3.33 |
3.30 - 3.41 |
1.3165 times |
Tue 28 October 2025 |
3.33 (-0.89%) |
3.35 |
3.30 - 3.37 |
0.8424 times |
Mon 27 October 2025 |
3.36 (-0.88%) |
3.39 |
3.34 - 3.45 |
0.9569 times |
Fri 24 October 2025 |
3.39 (-2.59%) |
3.49 |
3.38 - 3.50 |
0.8211 times |
Thu 23 October 2025 |
3.48 (2.96%) |
3.53 |
3.47 - 3.53 |
1.1801 times |
Wed 22 October 2025 |
3.38 (1.5%) |
3.29 |
3.26 - 3.40 |
0.6745 times |
Tue 21 October 2025 |
3.33 (-1.19%) |
3.39 |
3.33 - 3.41 |
1.2747 times |
Mon 20 October 2025 |
3.37 (0%) |
3.38 |
3.35 - 3.43 |
1.1779 times |
Fri 17 October 2025 |
3.37 (0%) |
3.37 |
3.32 - 3.41 |
0.9202 times |
Weekly price and charts BerryPetroleum Strong weekly Stock price targets for BerryPetroleum BRY are 3.24 and 3.41 | Weekly Target 1 | 3.2 | | Weekly Target 2 | 3.28 | | Weekly Target 3 | 3.3666666666667 | | Weekly Target 4 | 3.45 | | Weekly Target 5 | 3.54 |
Weekly price and volumes for Berry Petroleum
| Date |
Closing |
Open |
Range |
Volume |
Fri 31 October 2025 |
3.37 (-0.59%) |
3.39 |
3.28 - 3.45 |
0.3482 times |
Fri 24 October 2025 |
3.39 (0.59%) |
3.38 |
3.26 - 3.53 |
0.3665 times |
Fri 17 October 2025 |
3.37 (-3.16%) |
3.49 |
3.32 - 3.57 |
0.6389 times |
Fri 10 October 2025 |
3.48 (-8.9%) |
3.87 |
3.47 - 3.89 |
0.6839 times |
Fri 03 October 2025 |
3.82 (-4.74%) |
4.00 |
3.68 - 4.00 |
0.861 times |
Fri 26 September 2025 |
4.01 (2.82%) |
3.90 |
3.86 - 4.07 |
1.3704 times |
Fri 19 September 2025 |
3.90 (17.82%) |
3.77 |
3.72 - 4.15 |
4.1151 times |
Fri 12 September 2025 |
3.31 (3.12%) |
3.23 |
3.15 - 3.41 |
1.1924 times |
Fri 05 September 2025 |
3.21 (-3.89%) |
3.33 |
3.11 - 3.37 |
0.3384 times |
Fri 29 August 2025 |
3.34 (0%) |
3.26 |
3.24 - 3.38 |
0.0851 times |
Fri 29 August 2025 |
3.34 (11.71%) |
2.97 |
2.97 - 3.38 |
0.6271 times |
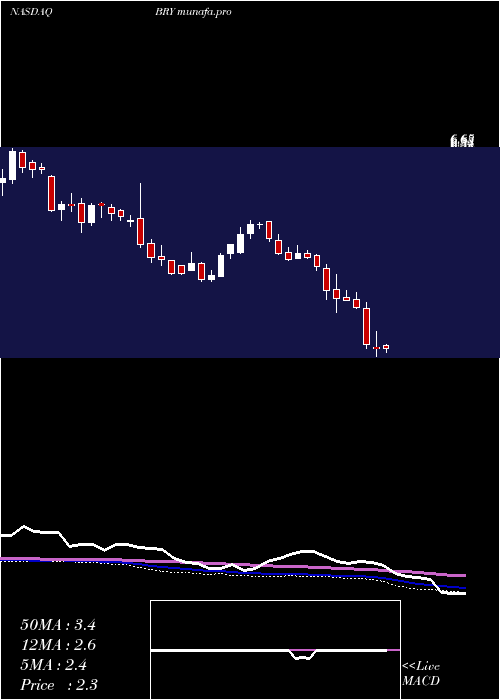
Monthly price and charts BerryPetroleum Strong monthly Stock price targets for BerryPetroleum BRY are 3 and 3.63 | Monthly Target 1 | 2.88 | | Monthly Target 2 | 3.12 | | Monthly Target 3 | 3.5066666666667 | | Monthly Target 4 | 3.75 | | Monthly Target 5 | 4.14 |
Monthly price and volumes Berry Petroleum
| Date |
Closing |
Open |
Range |
Volume |
Fri 31 October 2025 |
3.37 (-10.85%) |
3.75 |
3.26 - 3.89 |
0.7726 times |
Tue 30 September 2025 |
3.78 (13.17%) |
3.33 |
3.11 - 4.15 |
2.2699 times |
Fri 29 August 2025 |
3.34 (10.6%) |
3.01 |
2.71 - 3.38 |
0.7345 times |
Thu 31 July 2025 |
3.02 (9.03%) |
2.75 |
2.70 - 3.35 |
0.8176 times |
Mon 30 June 2025 |
2.77 (15.9%) |
2.46 |
2.40 - 3.39 |
1.0791 times |
Fri 30 May 2025 |
2.39 (-3.63%) |
2.46 |
2.36 - 3.20 |
0.8823 times |
Wed 30 April 2025 |
2.48 (-22.74%) |
3.23 |
2.11 - 3.27 |
0.9767 times |
Mon 31 March 2025 |
3.21 (-21.13%) |
4.03 |
3.06 - 4.11 |
0.8877 times |
Fri 28 February 2025 |
4.07 (-6.65%) |
4.38 |
3.98 - 4.54 |
0.538 times |
Fri 31 January 2025 |
4.36 (5.83%) |
4.17 |
4.17 - 5.09 |
1.0415 times |
Tue 31 December 2024 |
4.12 (5.1%) |
3.99 |
3.74 - 4.39 |
0.8077 times |

DMA SMA EMA moving averages of Berry Petroleum BRY
DMA (daily moving average) of Berry Petroleum BRY
| DMA period | DMA value | | 5 day DMA | 3.34 | | 12 day DMA | 3.37 | | 20 day DMA | 3.46 | | 35 day DMA | 3.66 | | 50 day DMA | 3.54 | | 100 day DMA | 3.27 | | 150 day DMA | 3.03 | | 200 day DMA | 3.28 | EMA (exponential moving average) of Berry Petroleum BRY
| EMA period | EMA current | EMA prev | EMA prev2 | | 5 day EMA | 3.36 | 3.35 | 3.36 | | 12 day EMA | 3.4 | 3.4 | 3.41 | | 20 day EMA | 3.45 | 3.46 | 3.47 | | 35 day EMA | 3.43 | 3.43 | 3.44 | | 50 day EMA | 3.45 | 3.45 | 3.46 |
SMA (simple moving average) of Berry Petroleum BRY
| SMA period | SMA current | SMA prev | SMA prev2 | | 5 day SMA | 3.34 | 3.35 | 3.38 | | 12 day SMA | 3.37 | 3.37 | 3.38 | | 20 day SMA | 3.46 | 3.49 | 3.5 | | 35 day SMA | 3.66 | 3.66 | 3.66 | | 50 day SMA | 3.54 | 3.53 | 3.52 | | 100 day SMA | 3.27 | 3.27 | 3.26 | | 150 day SMA | 3.03 | 3.03 | 3.03 | | 200 day SMA | 3.28 | 3.29 | 3.3 |
|
|
