NfEnergy BIMI full analysis,charts,indicators,moving averages,SMA,DMA,EMA,ADX,MACD,RSINf Energy BIMI WideScreen charts, DMA,SMA,EMA technical analysis, forecast prediction, by indicators ADX,MACD,RSI,CCI NASDAQ stock exchange
operates under Capital Goods sector & deals in Metal Fabrications
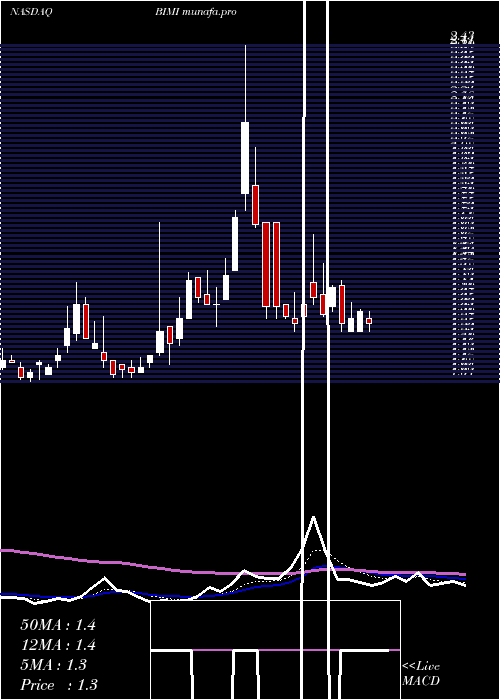
Daily price and charts and targets NfEnergy Strong Daily Stock price targets for NfEnergy BIMI are 1.01 and 1.22 | Daily Target 1 | 0.97 | | Daily Target 2 | 1.05 | | Daily Target 3 | 1.18 | | Daily Target 4 | 1.26 | | Daily Target 5 | 1.39 |
Daily price and volume Nf Energy
| Date |
Closing |
Open |
Range |
Volume |
Thu 23 May 2024 |
1.13 (-5.83%) |
1.16 |
1.10 - 1.31 |
0.7565 times |
Wed 22 May 2024 |
1.20 (-1.64%) |
1.18 |
1.18 - 1.29 |
0.3879 times |
Tue 21 May 2024 |
1.22 (-10.29%) |
1.36 |
1.22 - 1.39 |
0.6158 times |
Mon 20 May 2024 |
1.36 (7.94%) |
1.24 |
1.21 - 1.45 |
1.8201 times |
Fri 17 May 2024 |
1.26 (9.57%) |
1.19 |
1.16 - 1.35 |
1.8853 times |
Thu 16 May 2024 |
1.15 (4.55%) |
1.13 |
1.10 - 1.18 |
1.3269 times |
Wed 15 May 2024 |
1.10 (-1.79%) |
1.07 |
1.07 - 1.11 |
0.3537 times |
Tue 14 May 2024 |
1.12 (3.7%) |
1.11 |
1.05 - 1.13 |
0.4073 times |
Mon 13 May 2024 |
1.08 (1.89%) |
1.06 |
1.04 - 1.09 |
1.1541 times |
Fri 10 May 2024 |
1.06 (-5.36%) |
1.10 |
1.05 - 1.12 |
1.2923 times |
Thu 09 May 2024 |
1.12 (-0.88%) |
1.13 |
1.12 - 1.15 |
0.4437 times |
Weekly price and charts NfEnergy Strong weekly Stock price targets for NfEnergy BIMI are 0.94 and 1.29 | Weekly Target 1 | 0.88 | | Weekly Target 2 | 1 | | Weekly Target 3 | 1.2266666666667 | | Weekly Target 4 | 1.35 | | Weekly Target 5 | 1.58 |
Weekly price and volumes for Nf Energy
| Date |
Closing |
Open |
Range |
Volume |
Thu 23 May 2024 |
1.13 (-10.32%) |
1.24 |
1.10 - 1.45 |
0.5496 times |
Fri 17 May 2024 |
1.26 (18.87%) |
1.06 |
1.04 - 1.35 |
0.787 times |
Fri 10 May 2024 |
1.06 (-3.64%) |
1.12 |
1.05 - 1.18 |
0.5917 times |
Fri 03 May 2024 |
1.10 (-10.57%) |
1.23 |
1.02 - 1.27 |
0.8362 times |
Fri 26 April 2024 |
1.23 (-3.91%) |
1.21 |
1.10 - 1.44 |
1.0346 times |
Fri 19 April 2024 |
1.28 (23.08%) |
1.05 |
1.01 - 2.10 |
2.8898 times |
Fri 12 April 2024 |
1.04 (-32.9%) |
1.64 |
1.03 - 1.64 |
0.8206 times |
Fri 05 April 2024 |
1.55 (-7.74%) |
1.67 |
1.40 - 1.68 |
0.5486 times |
Thu 28 March 2024 |
1.68 (6.33%) |
1.52 |
1.49 - 2.09 |
0.7923 times |
Fri 22 March 2024 |
1.58 (-43.77%) |
2.80 |
1.56 - 3.16 |
1.1496 times |
Fri 15 March 2024 |
2.81 (-26.05%) |
3.86 |
2.51 - 3.93 |
0.4336 times |
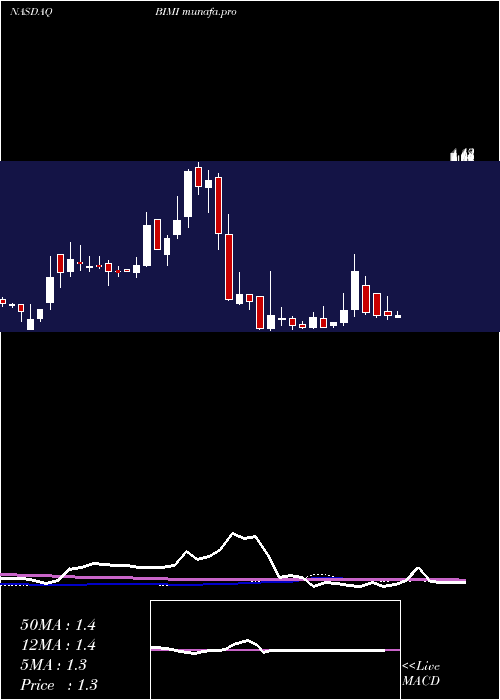
Monthly price and charts NfEnergy Strong monthly Stock price targets for NfEnergy BIMI are 0.86 and 1.29 | Monthly Target 1 | 0.77 | | Monthly Target 2 | 0.95 | | Monthly Target 3 | 1.2 | | Monthly Target 4 | 1.38 | | Monthly Target 5 | 1.63 |
Monthly price and volumes Nf Energy
| Date |
Closing |
Open |
Range |
Volume |
Thu 23 May 2024 |
1.13 (-5.04%) |
1.14 |
1.02 - 1.45 |
0.8136 times |
Tue 30 April 2024 |
1.19 (-29.17%) |
1.67 |
1.01 - 2.10 |
1.8396 times |
Thu 28 March 2024 |
1.68 (-56.59%) |
3.80 |
1.49 - 3.98 |
0.9554 times |
Thu 29 February 2024 |
3.87 (39.71%) |
2.65 |
2.21 - 4.13 |
0.9244 times |
Wed 31 January 2024 |
2.77 (26.48%) |
2.25 |
1.85 - 3.20 |
0.913 times |
Fri 29 December 2023 |
2.19 (12.31%) |
1.76 |
1.76 - 2.65 |
0.5845 times |
Thu 30 November 2023 |
1.95 (36.36%) |
1.46 |
1.03 - 2.39 |
0.5818 times |
Tue 31 October 2023 |
1.43 (-8.92%) |
1.54 |
1.34 - 1.70 |
0.329 times |
Fri 29 September 2023 |
1.57 (-34.03%) |
2.50 |
1.43 - 2.67 |
0.6883 times |
Thu 31 August 2023 |
2.38 (-30%) |
3.46 |
2.02 - 3.50 |
2.3705 times |
Mon 31 July 2023 |
3.40 (142.86%) |
1.44 |
1.41 - 3.48 |
3.827 times |

DMA SMA EMA moving averages of Nf Energy BIMI
DMA (daily moving average) of Nf Energy BIMI
| DMA period | DMA value | | 5 day DMA | 1.23 | | 12 day DMA | 1.16 | | 20 day DMA | 1.15 | | 35 day DMA | 1.22 | | 50 day DMA | 1.44 | | 100 day DMA | 2.16 | | 150 day DMA | 2.03 | | 200 day DMA | 2.01 | EMA (exponential moving average) of Nf Energy BIMI
| EMA period | EMA current | EMA prev | EMA prev2 | | 5 day EMA | 1.19 | 1.22 | 1.23 | | 12 day EMA | 1.18 | 1.19 | 1.19 | | 20 day EMA | 1.21 | 1.22 | 1.22 | | 35 day EMA | 1.39 | 1.41 | 1.42 | | 50 day EMA | 1.58 | 1.6 | 1.62 |
SMA (simple moving average) of Nf Energy BIMI
| SMA period | SMA current | SMA prev | SMA prev2 | | 5 day SMA | 1.23 | 1.24 | 1.22 | | 12 day SMA | 1.16 | 1.16 | 1.16 | | 20 day SMA | 1.15 | 1.16 | 1.16 | | 35 day SMA | 1.22 | 1.23 | 1.24 | | 50 day SMA | 1.44 | 1.48 | 1.52 | | 100 day SMA | 2.16 | 2.17 | 2.18 | | 150 day SMA | 2.03 | 2.03 | 2.03 | | 200 day SMA | 2.01 | 2.01 | 2.02 |
|
|
