AthiraPharma ATHA full analysis,charts,indicators,moving averages,SMA,DMA,EMA,ADX,MACD,RSIAthira Pharma ATHA WideScreen charts, DMA,SMA,EMA technical analysis, forecast prediction, by indicators ADX,MACD,RSI,CCI NASDAQ stock exchange
Daily price and charts and targets AthiraPharma Strong Daily Stock price targets for AthiraPharma ATHA are 5.82 and 9.28 | Daily Target 1 | 3.2 | | Daily Target 2 | 4.97 | | Daily Target 3 | 6.6633333333333 | | Daily Target 4 | 8.43 | | Daily Target 5 | 10.12 |
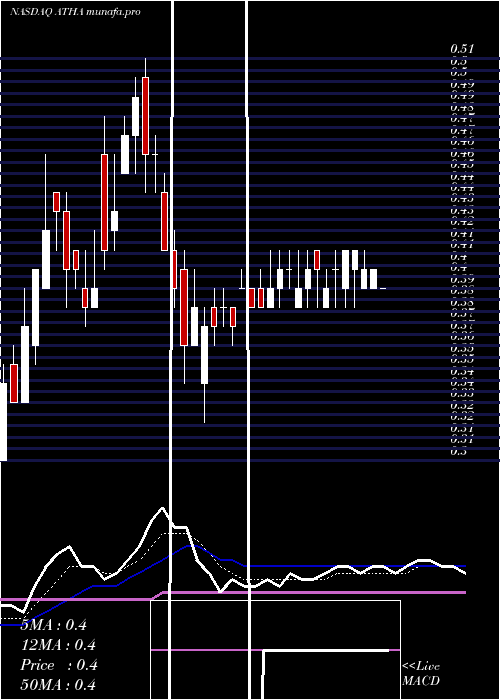
Daily price and volume Athira Pharma
| Date |
Closing |
Open |
Range |
Volume |
Thu 18 December 2025 |
6.73 (62.56%) |
4.90 |
4.90 - 8.36 |
9.9749 times |
Wed 17 December 2025 |
4.14 (6.7%) |
3.90 |
3.90 - 4.17 |
0.0053 times |
Tue 16 December 2025 |
3.88 (0.78%) |
3.85 |
3.80 - 3.95 |
0.0032 times |
Mon 15 December 2025 |
3.85 (-0.52%) |
4.05 |
3.85 - 4.05 |
0.0016 times |
Fri 12 December 2025 |
3.87 (-2.03%) |
3.89 |
3.86 - 4.13 |
0.0037 times |
Thu 11 December 2025 |
3.95 (-0.25%) |
3.96 |
3.92 - 4.12 |
0.0042 times |
Wed 10 December 2025 |
3.96 (-1.25%) |
4.00 |
3.96 - 4.34 |
0.002 times |
Tue 09 December 2025 |
4.01 (3.35%) |
3.84 |
3.84 - 4.03 |
0.0025 times |
Mon 08 December 2025 |
3.88 (-1.77%) |
3.92 |
3.87 - 3.92 |
0.0007 times |
Fri 05 December 2025 |
3.95 (1.28%) |
3.90 |
3.83 - 3.96 |
0.0021 times |
Thu 04 December 2025 |
3.90 (1.3%) |
3.87 |
3.81 - 3.97 |
0.0017 times |
Weekly price and charts AthiraPharma Strong weekly Stock price targets for AthiraPharma ATHA are 5.27 and 9.83 | Weekly Target 1 | 1.74 | | Weekly Target 2 | 4.23 | | Weekly Target 3 | 6.2966666666667 | | Weekly Target 4 | 8.79 | | Weekly Target 5 | 10.86 |
Weekly price and volumes for Athira Pharma
| Date |
Closing |
Open |
Range |
Volume |
Thu 18 December 2025 |
6.73 (73.9%) |
4.05 |
3.80 - 8.36 |
9.8141 times |
Fri 12 December 2025 |
3.87 (-2.03%) |
3.92 |
3.84 - 4.34 |
0.0127 times |
Fri 05 December 2025 |
3.95 (-9.2%) |
4.50 |
3.81 - 4.74 |
0.0211 times |
Fri 28 November 2025 |
4.35 (-5.64%) |
4.52 |
4.31 - 4.81 |
0.0097 times |
Fri 21 November 2025 |
4.61 (1.99%) |
4.55 |
4.34 - 5.00 |
0.0319 times |
Fri 14 November 2025 |
4.52 (17.4%) |
4.00 |
3.96 - 4.89 |
0.0254 times |
Fri 07 November 2025 |
3.85 (-7.45%) |
4.15 |
3.71 - 4.50 |
0.0325 times |
Fri 31 October 2025 |
4.16 (0%) |
4.16 |
4.06 - 4.21 |
0.0021 times |
Fri 31 October 2025 |
4.16 (2.21%) |
4.06 |
3.78 - 4.23 |
0.0135 times |
Fri 24 October 2025 |
4.07 (12.43%) |
3.64 |
3.62 - 4.30 |
0.0369 times |
Fri 17 October 2025 |
3.62 (-4.74%) |
3.81 |
3.60 - 3.93 |
0.0295 times |

Monthly price and charts AthiraPharma Strong monthly Stock price targets for AthiraPharma ATHA are 5.27 and 9.83 | Monthly Target 1 | 1.74 | | Monthly Target 2 | 4.23 | | Monthly Target 3 | 6.2966666666667 | | Monthly Target 4 | 8.79 | | Monthly Target 5 | 10.86 |
Monthly price and volumes Athira Pharma
| Date |
Closing |
Open |
Range |
Volume |
Thu 18 December 2025 |
6.73 (54.71%) |
4.50 |
3.80 - 8.36 |
4.8519 times |
Fri 28 November 2025 |
4.35 (4.57%) |
4.15 |
3.71 - 5.00 |
0.049 times |
Fri 31 October 2025 |
4.16 (0.48%) |
4.14 |
3.60 - 4.59 |
0.0666 times |
Tue 30 September 2025 |
4.14 (961.54%) |
0.38 |
0.35 - 4.49 |
0.327 times |
Fri 29 August 2025 |
0.39 (2.63%) |
0.34 |
0.32 - 0.41 |
0.229 times |
Thu 31 July 2025 |
0.38 (26.67%) |
0.30 |
0.29 - 0.51 |
0.6235 times |
Mon 30 June 2025 |
0.30 (-3.23%) |
0.30 |
0.27 - 0.37 |
1.8573 times |
Fri 30 May 2025 |
0.31 (10.71%) |
0.28 |
0.23 - 0.32 |
1.1387 times |
Wed 30 April 2025 |
0.28 (0%) |
0.28 |
0.22 - 0.31 |
0.4422 times |
Mon 31 March 2025 |
0.28 (-31.71%) |
0.41 |
0.27 - 0.44 |
0.4148 times |
Fri 28 February 2025 |
0.41 (-22.64%) |
0.51 |
0.37 - 0.55 |
0.3644 times |

DMA SMA EMA moving averages of Athira Pharma ATHA
DMA (daily moving average) of Athira Pharma ATHA
| DMA period | DMA value | | 5 day DMA | 4.49 | | 12 day DMA | 4.16 | | 20 day DMA | 4.27 | | 35 day DMA | 4.32 | | 50 day DMA | 4.2 | | 100 day DMA | 2.84 | | 150 day DMA | 2.01 | | 200 day DMA | 1.58 | EMA (exponential moving average) of Athira Pharma ATHA
| EMA period | EMA current | EMA prev | EMA prev2 | | 5 day EMA | 4.9 | 3.98 | 3.9 | | 12 day EMA | 4.45 | 4.03 | 4.01 | | 20 day EMA | 4.33 | 4.08 | 4.07 | | 35 day EMA | 4.25 | 4.1 | 4.1 | | 50 day EMA | 4.23 | 4.13 | 4.13 |
SMA (simple moving average) of Athira Pharma ATHA
| SMA period | SMA current | SMA prev | SMA prev2 | | 5 day SMA | 4.49 | 3.94 | 3.9 | | 12 day SMA | 4.16 | 3.95 | 3.96 | | 20 day SMA | 4.27 | 4.17 | 4.19 | | 35 day SMA | 4.32 | 4.25 | 4.25 | | 50 day SMA | 4.2 | 4.14 | 4.14 | | 100 day SMA | 2.84 | 2.78 | 2.74 | | 150 day SMA | 2.01 | 1.96 | 1.94 | | 200 day SMA | 1.58 | 1.54 | 1.52 |
|
|
