AnteriosInc ANTE full analysis,charts,indicators,moving averages,SMA,DMA,EMA,ADX,MACD,RSIAnterios Inc ANTE WideScreen charts, DMA,SMA,EMA technical analysis, forecast prediction, by indicators ADX,MACD,RSI,CCI NASDAQ stock exchange
operates under N/a sector & deals in N/a
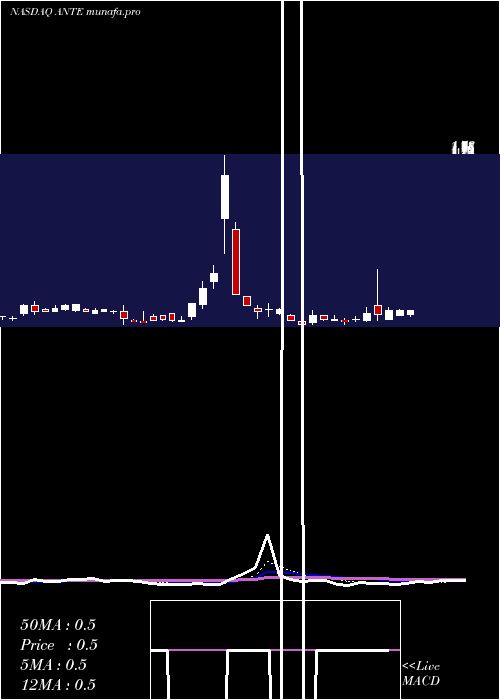
Daily price and charts and targets AnteriosInc Strong Daily Stock price targets for AnteriosInc ANTE are 2.73 and 5.5 | Daily Target 1 | 2.2 | | Daily Target 2 | 3.26 | | Daily Target 3 | 4.9733333333333 | | Daily Target 4 | 6.03 | | Daily Target 5 | 7.74 |
Daily price and volume Anterios Inc
| Date |
Closing |
Open |
Range |
Volume |
Fri 29 August 2025 |
4.31 (2.38%) |
4.93 |
3.92 - 6.69 |
1.1244 times |
Thu 28 August 2025 |
4.21 (25.3%) |
3.27 |
3.13 - 4.25 |
0.3344 times |
Wed 27 August 2025 |
3.36 (20.43%) |
2.69 |
2.66 - 3.38 |
0.2812 times |
Tue 26 August 2025 |
2.79 (1.45%) |
2.73 |
2.58 - 2.82 |
0.2096 times |
Mon 25 August 2025 |
2.75 (-2.14%) |
2.77 |
2.55 - 2.95 |
0.2228 times |
Fri 22 August 2025 |
2.81 (27.73%) |
2.10 |
2.06 - 3.90 |
7.1829 times |
Thu 21 August 2025 |
2.20 (-26.91%) |
3.01 |
1.80 - 3.37 |
0.3824 times |
Wed 20 August 2025 |
3.01 (6.36%) |
2.89 |
2.75 - 3.10 |
0.0652 times |
Tue 19 August 2025 |
2.83 (9.69%) |
2.60 |
2.60 - 3.13 |
0.1177 times |
Mon 18 August 2025 |
2.58 (-4.44%) |
2.71 |
2.53 - 2.97 |
0.0794 times |
Fri 15 August 2025 |
2.70 (12.5%) |
2.41 |
2.25 - 2.82 |
0.0836 times |
Weekly price and charts AnteriosInc Strong weekly Stock price targets for AnteriosInc ANTE are 3.43 and 7.57 | Weekly Target 1 | 0.38 | | Weekly Target 2 | 2.34 | | Weekly Target 3 | 4.5166666666667 | | Weekly Target 4 | 6.48 | | Weekly Target 5 | 8.66 |
Weekly price and volumes for Anterios Inc
| Date |
Closing |
Open |
Range |
Volume |
Fri 29 August 2025 |
4.31 (53.38%) |
2.77 |
2.55 - 6.69 |
1.6321 times |
Fri 22 August 2025 |
2.81 (4.07%) |
2.71 |
1.80 - 3.90 |
5.8809 times |
Fri 15 August 2025 |
2.70 (15.38%) |
2.53 |
1.95 - 3.67 |
0.9957 times |
Fri 08 August 2025 |
2.34 (27.17%) |
2.19 |
2.19 - 2.84 |
0.4393 times |
Fri 01 August 2025 |
1.84 (32.37%) |
1.45 |
1.12 - 2.00 |
0.3357 times |
Fri 25 July 2025 |
1.39 (29.91%) |
1.04 |
1.02 - 1.50 |
0.0977 times |
Fri 18 July 2025 |
1.07 (0.94%) |
1.10 |
0.94 - 1.10 |
0.0936 times |
Fri 11 July 2025 |
1.06 (63.08%) |
0.60 |
0.60 - 1.18 |
0.3572 times |
Thu 03 July 2025 |
0.65 (1.56%) |
0.57 |
0.57 - 0.68 |
0.147 times |
Fri 27 June 2025 |
0.64 (-5.88%) |
0.68 |
0.63 - 0.75 |
0.0207 times |
Fri 20 June 2025 |
0.68 (-9.33%) |
0.75 |
0.64 - 0.75 |
0.0192 times |

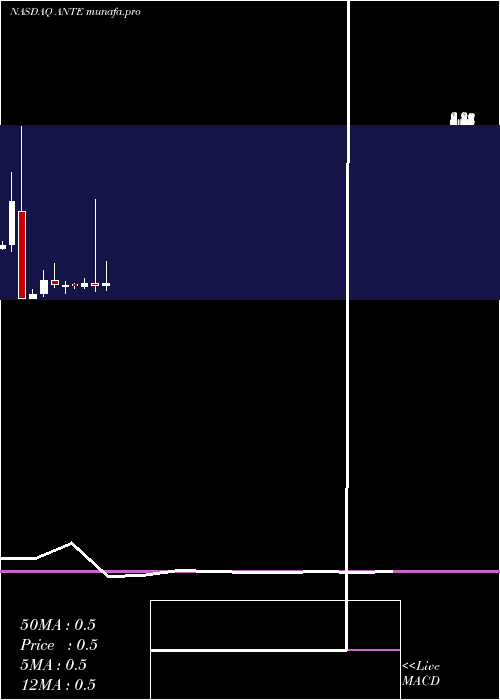
Monthly price and charts AnteriosInc Strong monthly Stock price targets for AnteriosInc ANTE are 3.02 and 7.98 | Monthly Target 1 | -0.72 | | Monthly Target 2 | 1.8 | | Monthly Target 3 | 4.2433333333333 | | Monthly Target 4 | 6.76 | | Monthly Target 5 | 9.2 |
Monthly price and volumes Anterios Inc
| Date |
Closing |
Open |
Range |
Volume |
Fri 29 August 2025 |
4.31 (167.7%) |
1.84 |
1.73 - 6.69 |
1.4451 times |
Thu 31 July 2025 |
1.61 (155.56%) |
0.66 |
0.57 - 1.65 |
0.1231 times |
Mon 30 June 2025 |
0.63 (-16%) |
0.75 |
0.54 - 0.83 |
0.0312 times |
Fri 30 May 2025 |
0.75 (-2.6%) |
0.76 |
0.68 - 0.97 |
0.0632 times |
Wed 30 April 2025 |
0.77 (67.39%) |
0.46 |
0.39 - 0.87 |
0.9773 times |
Mon 31 March 2025 |
0.46 (-6.12%) |
0.49 |
0.38 - 1.78 |
6.9659 times |
Fri 28 February 2025 |
0.49 (4.26%) |
0.45 |
0.42 - 0.58 |
0.1142 times |
Fri 31 January 2025 |
0.47 (0%) |
0.48 |
0.42 - 0.49 |
0.0386 times |
Tue 31 December 2024 |
0.47 (-2.08%) |
0.45 |
0.35 - 0.52 |
0.0662 times |
Tue 26 November 2024 |
0.48 (-11.11%) |
0.54 |
0.44 - 0.81 |
0.1751 times |
Thu 31 October 2024 |
0.54 (63.64%) |
0.34 |
0.30 - 0.70 |
0.5895 times |
DMA SMA EMA moving averages of Anterios Inc ANTE
DMA (daily moving average) of Anterios Inc ANTE
| DMA period | DMA value | | 5 day DMA | 3.48 | | 12 day DMA | 3 | | 20 day DMA | 2.81 | | 35 day DMA | 2.13 | | 50 day DMA | 1.7 | | 100 day DMA | 1.23 | | 150 day DMA | 0.98 | | 200 day DMA | 0.86 | EMA (exponential moving average) of Anterios Inc ANTE
| EMA period | EMA current | EMA prev | EMA prev2 | | 5 day EMA | 3.68 | 3.36 | 2.93 | | 12 day EMA | 3.16 | 2.95 | 2.72 | | 20 day EMA | 2.79 | 2.63 | 2.46 | | 35 day EMA | 2.3 | 2.18 | 2.06 | | 50 day EMA | 1.8 | 1.7 | 1.6 |
SMA (simple moving average) of Anterios Inc ANTE
| SMA period | SMA current | SMA prev | SMA prev2 | | 5 day SMA | 3.48 | 3.18 | 2.78 | | 12 day SMA | 3 | 2.81 | 2.69 | | 20 day SMA | 2.81 | 2.68 | 2.54 | | 35 day SMA | 2.13 | 2.04 | 1.94 | | 50 day SMA | 1.7 | 1.63 | 1.56 | | 100 day SMA | 1.23 | 1.19 | 1.15 | | 150 day SMA | 0.98 | 0.96 | 0.93 | | 200 day SMA | 0.86 | 0.84 | 0.82 |
|
|
