AllovirInc ALVR full analysis,charts,indicators,moving averages,SMA,DMA,EMA,ADX,MACD,RSIAllovir Inc ALVR WideScreen charts, DMA,SMA,EMA technical analysis, forecast prediction, by indicators ADX,MACD,RSI,CCI NASDAQ stock exchange
Daily price and charts and targets AllovirInc Strong Daily Stock price targets for AllovirInc ALVR are 0.73 and 0.8 | Daily Target 1 | 0.71 | | Daily Target 2 | 0.74 | | Daily Target 3 | 0.78 | | Daily Target 4 | 0.81 | | Daily Target 5 | 0.85 |
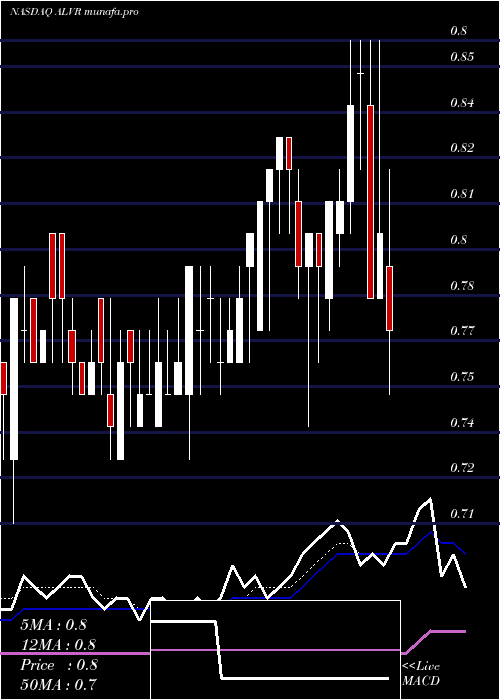
Daily price and volume Allovir Inc
| Date |
Closing |
Open |
Range |
Volume |
Thu 17 October 2024 |
0.77 (-3.75%) |
0.79 |
0.75 - 0.82 |
0.7231 times |
Wed 16 October 2024 |
0.80 (2.56%) |
0.78 |
0.78 - 0.86 |
0.12 times |
Tue 15 October 2024 |
0.78 (-8.24%) |
0.84 |
0.78 - 0.86 |
1.0048 times |
Mon 14 October 2024 |
0.85 (1.19%) |
0.85 |
0.82 - 0.86 |
0.5964 times |
Fri 11 October 2024 |
0.84 (3.7%) |
0.81 |
0.80 - 0.86 |
1.4481 times |
Thu 10 October 2024 |
0.81 (0%) |
0.80 |
0.79 - 0.82 |
1.4371 times |
Wed 09 October 2024 |
0.81 (2.53%) |
0.78 |
0.77 - 0.81 |
1.9195 times |
Tue 08 October 2024 |
0.79 (-1.25%) |
0.80 |
0.76 - 0.80 |
0.4041 times |
Mon 07 October 2024 |
0.80 (1.27%) |
0.79 |
0.74 - 0.80 |
1.6452 times |
Fri 04 October 2024 |
0.79 (-3.66%) |
0.81 |
0.78 - 0.82 |
0.7017 times |
Thu 03 October 2024 |
0.82 (-1.2%) |
0.83 |
0.80 - 0.83 |
0.0851 times |
Weekly price and charts AllovirInc Strong weekly Stock price targets for AllovirInc ALVR are 0.71 and 0.82 | Weekly Target 1 | 0.68 | | Weekly Target 2 | 0.73 | | Weekly Target 3 | 0.79333333333333 | | Weekly Target 4 | 0.84 | | Weekly Target 5 | 0.9 |
Weekly price and volumes for Allovir Inc
| Date |
Closing |
Open |
Range |
Volume |
Thu 17 October 2024 |
0.77 (-8.33%) |
0.85 |
0.75 - 0.86 |
0.5676 times |
Fri 11 October 2024 |
0.84 (6.33%) |
0.79 |
0.74 - 0.86 |
1.5917 times |
Fri 04 October 2024 |
0.79 (-1.25%) |
0.77 |
0.77 - 0.83 |
0.6881 times |
Fri 27 September 2024 |
0.80 (3.9%) |
0.78 |
0.75 - 0.80 |
1.0013 times |
Fri 20 September 2024 |
0.77 (2.67%) |
0.74 |
0.73 - 0.79 |
2.1367 times |
Fri 13 September 2024 |
0.75 (-1.32%) |
0.75 |
0.73 - 0.78 |
0.7173 times |
Fri 06 September 2024 |
0.76 (-2.56%) |
0.77 |
0.75 - 0.78 |
0.6146 times |
Fri 30 August 2024 |
0.78 (0%) |
0.80 |
0.76 - 0.80 |
0.1247 times |
Fri 30 August 2024 |
0.78 (4%) |
0.73 |
0.71 - 0.80 |
1.7372 times |
Fri 23 August 2024 |
0.75 (1.35%) |
0.74 |
0.73 - 0.78 |
0.8207 times |
Fri 16 August 2024 |
0.74 (2.78%) |
0.74 |
0.71 - 0.75 |
0.9562 times |

Monthly price and charts AllovirInc Strong monthly Stock price targets for AllovirInc ALVR are 0.7 and 0.82 | Monthly Target 1 | 0.67 | | Monthly Target 2 | 0.72 | | Monthly Target 3 | 0.79 | | Monthly Target 4 | 0.84 | | Monthly Target 5 | 0.91 |
Monthly price and volumes Allovir Inc
| Date |
Closing |
Open |
Range |
Volume |
Thu 17 October 2024 |
0.77 (-4.94%) |
0.81 |
0.74 - 0.86 |
0.1476 times |
Mon 30 September 2024 |
0.81 (3.85%) |
0.77 |
0.73 - 0.81 |
0.2492 times |
Fri 30 August 2024 |
0.78 (5.41%) |
0.77 |
0.70 - 0.80 |
0.3001 times |
Wed 31 July 2024 |
0.74 (2.78%) |
0.72 |
0.70 - 0.84 |
0.4561 times |
Fri 28 June 2024 |
0.72 (-4%) |
0.77 |
0.70 - 0.80 |
0.8941 times |
Fri 31 May 2024 |
0.75 (-5.06%) |
0.80 |
0.58 - 0.82 |
0.5262 times |
Tue 30 April 2024 |
0.79 (5.33%) |
0.76 |
0.71 - 0.85 |
0.8543 times |
Thu 28 March 2024 |
0.75 (1.35%) |
0.75 |
0.67 - 0.80 |
0.7504 times |
Thu 29 February 2024 |
0.74 (2.78%) |
0.72 |
0.64 - 0.77 |
1.3677 times |
Wed 31 January 2024 |
0.72 (5.88%) |
0.68 |
0.62 - 0.74 |
4.4543 times |
Fri 29 December 2023 |
0.68 (-63.83%) |
1.96 |
0.64 - 2.49 |
4.8578 times |

DMA SMA EMA moving averages of Allovir Inc ALVR
DMA (daily moving average) of Allovir Inc ALVR
| DMA period | DMA value | | 5 day DMA | 0.81 | | 12 day DMA | 0.81 | | 20 day DMA | 0.8 | | 35 day DMA | 0.78 | | 50 day DMA | 0.77 | | 100 day DMA | 0.77 | | 150 day DMA | 0.77 | | 200 day DMA | 0.75 | EMA (exponential moving average) of Allovir Inc ALVR
| EMA period | EMA current | EMA prev | EMA prev2 | | 5 day EMA | 0.8 | 0.81 | 0.81 | | 12 day EMA | 0.8 | 0.81 | 0.81 | | 20 day EMA | 0.8 | 0.8 | 0.8 | | 35 day EMA | 0.77 | 0.77 | 0.77 | | 50 day EMA | 0.77 | 0.77 | 0.77 |
SMA (simple moving average) of Allovir Inc ALVR
| SMA period | SMA current | SMA prev | SMA prev2 | | 5 day SMA | 0.81 | 0.82 | 0.82 | | 12 day SMA | 0.81 | 0.81 | 0.81 | | 20 day SMA | 0.8 | 0.8 | 0.8 | | 35 day SMA | 0.78 | 0.78 | 0.78 | | 50 day SMA | 0.77 | 0.77 | 0.77 | | 100 day SMA | 0.77 | 0.77 | 0.77 | | 150 day SMA | 0.77 | 0.77 | 0.77 | | 200 day SMA | 0.75 | 0.75 | 0.75 |
|
|
