AdverumBiotechnologies ADVM full analysis,charts,indicators,moving averages,SMA,DMA,EMA,ADX,MACD,RSIAdverum Biotechnologies ADVM WideScreen charts, DMA,SMA,EMA technical analysis, forecast prediction, by indicators ADX,MACD,RSI,CCI NASDAQ stock exchange
operates under Health Care sector & deals in Biotechnology Biological Products No Diagnostic Substances
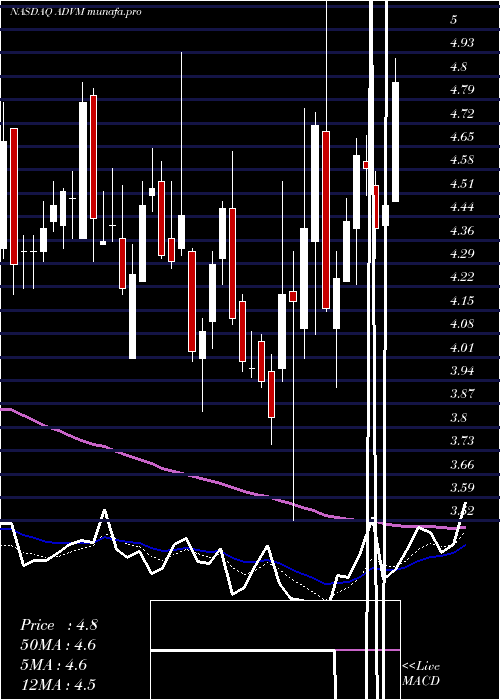
Daily price and charts and targets AdverumBiotechnologies Strong Daily Stock price targets for AdverumBiotechnologies ADVM are 4.24 and 4.37 | Daily Target 1 | 4.13 | | Daily Target 2 | 4.22 | | Daily Target 3 | 4.2633333333333 | | Daily Target 4 | 4.35 | | Daily Target 5 | 4.39 |
Daily price and volume Adverum Biotechnologies
| Date |
Closing |
Open |
Range |
Volume |
Fri 31 October 2025 |
4.30 (1.65%) |
4.20 |
4.18 - 4.31 |
0.4597 times |
Thu 30 October 2025 |
4.23 (0%) |
4.20 |
4.20 - 4.34 |
0.1779 times |
Wed 29 October 2025 |
4.23 (-0.7%) |
4.18 |
4.18 - 4.29 |
0.2051 times |
Tue 28 October 2025 |
4.26 (0.47%) |
4.19 |
4.14 - 4.28 |
0.3382 times |
Mon 27 October 2025 |
4.24 (4.43%) |
4.05 |
3.98 - 4.26 |
0.7763 times |
Fri 24 October 2025 |
4.06 (-2.87%) |
4.42 |
3.98 - 4.61 |
7.8225 times |
Thu 23 October 2025 |
4.18 (-1.65%) |
4.24 |
4.15 - 4.38 |
0.0627 times |
Wed 22 October 2025 |
4.25 (-4.92%) |
4.43 |
4.11 - 4.49 |
0.0556 times |
Tue 21 October 2025 |
4.47 (0.22%) |
4.47 |
4.16 - 4.53 |
0.0514 times |
Mon 20 October 2025 |
4.46 (2.06%) |
4.29 |
4.27 - 4.50 |
0.0506 times |
Fri 17 October 2025 |
4.37 (-5.41%) |
4.62 |
4.23 - 4.62 |
0.0522 times |
Weekly price and charts AdverumBiotechnologies Strong weekly Stock price targets for AdverumBiotechnologies ADVM are 4.14 and 4.5 | Weekly Target 1 | 3.85 | | Weekly Target 2 | 4.07 | | Weekly Target 3 | 4.2066666666667 | | Weekly Target 4 | 4.43 | | Weekly Target 5 | 4.57 |
Weekly price and volumes for Adverum Biotechnologies
| Date |
Closing |
Open |
Range |
Volume |
Fri 31 October 2025 |
4.30 (5.91%) |
4.05 |
3.98 - 4.34 |
0.9772 times |
Fri 24 October 2025 |
4.06 (-7.09%) |
4.29 |
3.98 - 4.61 |
4.0161 times |
Fri 17 October 2025 |
4.37 (-9.15%) |
4.86 |
4.10 - 4.95 |
0.2996 times |
Fri 10 October 2025 |
4.81 (-12.39%) |
5.65 |
4.72 - 5.75 |
0.3959 times |
Fri 03 October 2025 |
5.49 (21.73%) |
4.69 |
4.34 - 5.75 |
0.5814 times |
Fri 26 September 2025 |
4.51 (19.95%) |
4.05 |
3.25 - 5.19 |
3.2421 times |
Fri 19 September 2025 |
3.76 (24.5%) |
3.09 |
2.87 - 3.84 |
0.2379 times |
Fri 12 September 2025 |
3.02 (-14.2%) |
3.52 |
2.95 - 3.59 |
0.1398 times |
Fri 05 September 2025 |
3.52 (14.29%) |
3.03 |
2.93 - 3.57 |
0.0909 times |
Fri 29 August 2025 |
3.08 (0%) |
3.05 |
2.97 - 3.14 |
0.0191 times |
Fri 29 August 2025 |
3.08 (3.7%) |
2.98 |
2.97 - 3.25 |
0.0919 times |

Monthly price and charts AdverumBiotechnologies Strong monthly Stock price targets for AdverumBiotechnologies ADVM are 3.26 and 5.03 | Monthly Target 1 | 2.91 | | Monthly Target 2 | 3.6 | | Monthly Target 3 | 4.6766666666667 | | Monthly Target 4 | 5.37 | | Monthly Target 5 | 6.45 |
Monthly price and volumes Adverum Biotechnologies
| Date |
Closing |
Open |
Range |
Volume |
Fri 31 October 2025 |
4.30 (-5.08%) |
4.56 |
3.98 - 5.75 |
2.8572 times |
Tue 30 September 2025 |
4.53 (47.08%) |
3.03 |
2.87 - 5.19 |
1.827 times |
Fri 29 August 2025 |
3.08 (28.87%) |
2.35 |
2.20 - 3.25 |
0.2635 times |
Thu 31 July 2025 |
2.39 (11.16%) |
2.14 |
2.11 - 2.91 |
0.3675 times |
Mon 30 June 2025 |
2.15 (-3.15%) |
2.25 |
2.13 - 3.10 |
0.9331 times |
Fri 30 May 2025 |
2.22 (-31.9%) |
3.26 |
1.78 - 3.64 |
1.2533 times |
Wed 30 April 2025 |
3.26 (-25.4%) |
4.26 |
2.64 - 4.48 |
1.0775 times |
Mon 31 March 2025 |
4.37 (-7.22%) |
4.69 |
3.92 - 5.72 |
0.3801 times |
Fri 28 February 2025 |
4.71 (11.61%) |
4.01 |
3.52 - 4.93 |
0.5298 times |
Fri 31 January 2025 |
4.22 (-9.64%) |
4.75 |
4.01 - 5.11 |
0.5108 times |
Tue 31 December 2024 |
4.67 (-24.19%) |
5.92 |
4.42 - 6.12 |
0.493 times |

DMA SMA EMA moving averages of Adverum Biotechnologies ADVM
DMA (daily moving average) of Adverum Biotechnologies ADVM
| DMA period | DMA value | | 5 day DMA | 4.25 | | 12 day DMA | 4.31 | | 20 day DMA | 4.51 | | 35 day DMA | 4.33 | | 50 day DMA | 3.99 | | 100 day DMA | 3.27 | | 150 day DMA | 3.15 | | 200 day DMA | 3.47 | EMA (exponential moving average) of Adverum Biotechnologies ADVM
| EMA period | EMA current | EMA prev | EMA prev2 | | 5 day EMA | 4.26 | 4.24 | 4.24 | | 12 day EMA | 4.32 | 4.32 | 4.34 | | 20 day EMA | 4.35 | 4.35 | 4.36 | | 35 day EMA | 4.15 | 4.14 | 4.13 | | 50 day EMA | 3.93 | 3.91 | 3.9 |
SMA (simple moving average) of Adverum Biotechnologies ADVM
| SMA period | SMA current | SMA prev | SMA prev2 | | 5 day SMA | 4.25 | 4.2 | 4.19 | | 12 day SMA | 4.31 | 4.32 | 4.35 | | 20 day SMA | 4.51 | 4.57 | 4.62 | | 35 day SMA | 4.33 | 4.29 | 4.26 | | 50 day SMA | 3.99 | 3.96 | 3.94 | | 100 day SMA | 3.27 | 3.26 | 3.24 | | 150 day SMA | 3.15 | 3.14 | 3.14 | | 200 day SMA | 3.47 | 3.47 | 3.48 |
|
|
