AmerisBancorp ABCB full analysis,charts,indicators,moving averages,SMA,DMA,EMA,ADX,MACD,RSIAmeris Bancorp ABCB WideScreen charts, DMA,SMA,EMA technical analysis, forecast prediction, by indicators ADX,MACD,RSI,CCI NASDAQ stock exchange
operates under Finance sector & deals in Major Banks
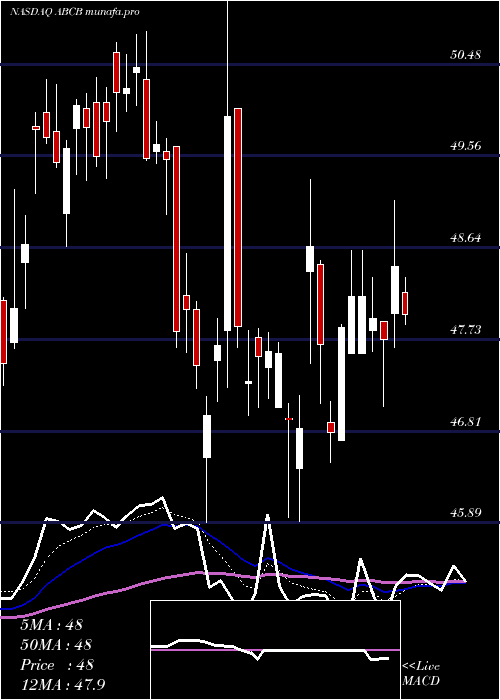
Daily price and charts and targets AmerisBancorp Strong Daily Stock price targets for AmerisBancorp ABCB are 46.73 and 48.74 | Daily Target 1 | 46.36 | | Daily Target 2 | 47.09 | | Daily Target 3 | 48.373333333333 | | Daily Target 4 | 49.1 | | Daily Target 5 | 50.38 |
Daily price and volume Ameris Bancorp
| Date |
Closing |
Open |
Range |
Volume |
Thu 23 May 2024 |
47.81 (-3.47%) |
49.66 |
47.65 - 49.66 |
0.9713 times |
Wed 22 May 2024 |
49.53 (-0.3%) |
49.60 |
48.98 - 49.74 |
1.5097 times |
Tue 21 May 2024 |
49.68 (0.28%) |
49.60 |
49.48 - 49.91 |
0.8431 times |
Mon 20 May 2024 |
49.54 (-1.8%) |
50.32 |
49.52 - 50.81 |
0.8922 times |
Fri 17 May 2024 |
50.45 (0.42%) |
50.40 |
50.07 - 50.78 |
1.0232 times |
Thu 16 May 2024 |
50.24 (0.08%) |
50.19 |
50.00 - 50.58 |
0.843 times |
Wed 15 May 2024 |
50.20 (0.58%) |
50.60 |
49.80 - 50.70 |
1.0607 times |
Tue 14 May 2024 |
49.91 (0.71%) |
50.10 |
49.34 - 50.25 |
0.8722 times |
Mon 13 May 2024 |
49.56 (-0.58%) |
50.10 |
49.45 - 50.35 |
1.033 times |
Fri 10 May 2024 |
49.85 (-0.44%) |
50.04 |
49.31 - 50.19 |
0.9516 times |
Thu 09 May 2024 |
50.07 (0.89%) |
49.84 |
49.38 - 50.12 |
1.1942 times |
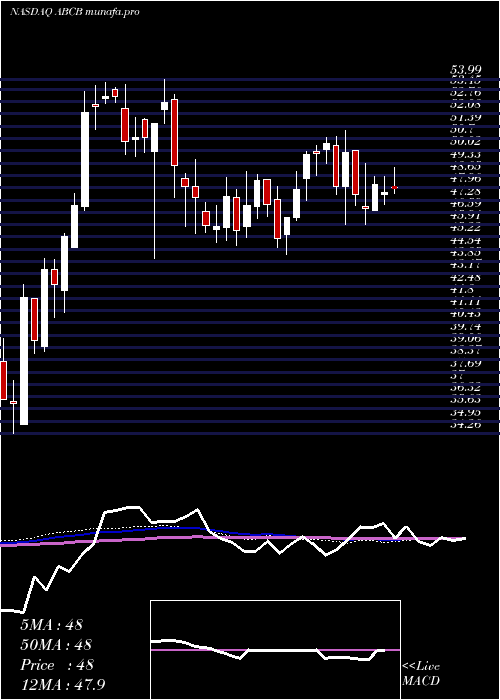
Weekly price and charts AmerisBancorp Strong weekly Stock price targets for AmerisBancorp ABCB are 46.15 and 49.31 | Weekly Target 1 | 45.6 | | Weekly Target 2 | 46.7 | | Weekly Target 3 | 48.756666666667 | | Weekly Target 4 | 49.86 | | Weekly Target 5 | 51.92 |
Weekly price and volumes for Ameris Bancorp
| Date |
Closing |
Open |
Range |
Volume |
Thu 23 May 2024 |
47.81 (-5.23%) |
50.32 |
47.65 - 50.81 |
0.6053 times |
Fri 17 May 2024 |
50.45 (1.2%) |
50.10 |
49.34 - 50.78 |
0.6937 times |
Fri 10 May 2024 |
49.85 (0.06%) |
49.99 |
48.66 - 50.32 |
0.7684 times |
Fri 03 May 2024 |
49.82 (4.05%) |
48.51 |
47.27 - 49.99 |
1.3091 times |
Fri 26 April 2024 |
47.88 (3.46%) |
46.32 |
46.12 - 48.87 |
1.0582 times |
Fri 19 April 2024 |
46.28 (2.48%) |
45.33 |
44.23 - 46.33 |
0.84 times |
Fri 12 April 2024 |
45.16 (-3.98%) |
47.29 |
44.64 - 48.04 |
1.0193 times |
Fri 05 April 2024 |
47.03 (-2.79%) |
48.41 |
46.38 - 48.41 |
1.3088 times |
Thu 28 March 2024 |
48.38 (2.96%) |
46.94 |
46.23 - 48.70 |
0.9052 times |
Fri 22 March 2024 |
46.99 (3.07%) |
45.79 |
45.17 - 48.87 |
1.492 times |
Fri 15 March 2024 |
45.59 (-4.02%) |
47.42 |
44.77 - 47.84 |
1.6549 times |
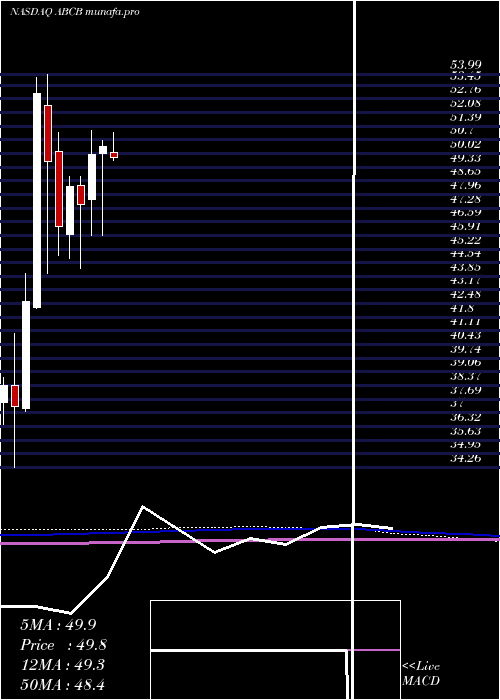
Monthly price and charts AmerisBancorp Strong monthly Stock price targets for AmerisBancorp ABCB are 47.73 and 50.9 | Monthly Target 1 | 45.58 | | Monthly Target 2 | 46.7 | | Monthly Target 3 | 48.753333333333 | | Monthly Target 4 | 49.87 | | Monthly Target 5 | 51.92 |
Monthly price and volumes Ameris Bancorp
| Date |
Closing |
Open |
Range |
Volume |
Thu 23 May 2024 |
47.81 (0.7%) |
47.69 |
47.64 - 50.81 |
0.5302 times |
Tue 30 April 2024 |
47.48 (-1.86%) |
48.41 |
44.23 - 48.87 |
0.8939 times |
Thu 28 March 2024 |
48.38 (4.42%) |
45.97 |
44.77 - 48.87 |
1.0328 times |
Thu 29 February 2024 |
46.33 (-6.67%) |
50.10 |
44.92 - 51.09 |
1.1923 times |
Wed 31 January 2024 |
49.64 (-6.43%) |
52.41 |
44.00 - 53.99 |
1.1171 times |
Fri 29 December 2023 |
53.05 (24.59%) |
42.29 |
42.25 - 53.84 |
1.3394 times |
Thu 30 November 2023 |
42.58 (14.16%) |
37.23 |
37.05 - 44.01 |
0.9474 times |
Tue 31 October 2023 |
37.30 (-2.84%) |
38.39 |
34.26 - 40.99 |
1.0285 times |
Fri 29 September 2023 |
38.39 (-5.79%) |
41.15 |
36.40 - 42.22 |
1.1021 times |
Thu 31 August 2023 |
40.75 (-6.64%) |
43.42 |
38.74 - 45.34 |
0.8163 times |
Mon 31 July 2023 |
43.65 (27.59%) |
34.25 |
33.21 - 44.74 |
1.1622 times |
DMA SMA EMA moving averages of Ameris Bancorp ABCB
DMA (daily moving average) of Ameris Bancorp ABCB
| DMA period | DMA value | | 5 day DMA | 49.4 | | 12 day DMA | 49.71 | | 20 day DMA | 49.31 | | 35 day DMA | 47.99 | | 50 day DMA | 47.67 | | 100 day DMA | 48.22 | | 150 day DMA | 47.02 | | 200 day DMA | 45.02 | EMA (exponential moving average) of Ameris Bancorp ABCB
| EMA period | EMA current | EMA prev | EMA prev2 | | 5 day EMA | 49.1 | 49.75 | 49.86 | | 12 day EMA | 49.33 | 49.61 | 49.62 | | 20 day EMA | 49.07 | 49.2 | 49.16 | | 35 day EMA | 48.54 | 48.58 | 48.52 | | 50 day EMA | 47.78 | 47.78 | 47.71 |
SMA (simple moving average) of Ameris Bancorp ABCB
| SMA period | SMA current | SMA prev | SMA prev2 | | 5 day SMA | 49.4 | 49.89 | 50.02 | | 12 day SMA | 49.71 | 49.85 | 49.87 | | 20 day SMA | 49.31 | 49.29 | 49.23 | | 35 day SMA | 47.99 | 47.96 | 47.89 | | 50 day SMA | 47.67 | 47.63 | 47.57 | | 100 day SMA | 48.22 | 48.26 | 48.29 | | 150 day SMA | 47.02 | 46.94 | 46.86 | | 200 day SMA | 45.02 | 44.99 | 44.97 |
|
|
