US DSEH full analysis,charts,indicators,moving averages,SMA,DMA,EMA,ADX,MACD,RSIU S DSEH WideScreen charts, DMA,SMA,EMA technical analysis, forecast prediction, by indicators ADX,MACD,RSI,CCI INDICES stock exchange
Daily price and charts and targets US Strong Daily Stock price targets for US DSEH are 56.87 and 57.44 | Daily Target 1 | 56.44 | | Daily Target 2 | 56.72 | | Daily Target 3 | 57.006666666667 | | Daily Target 4 | 57.29 | | Daily Target 5 | 57.58 |
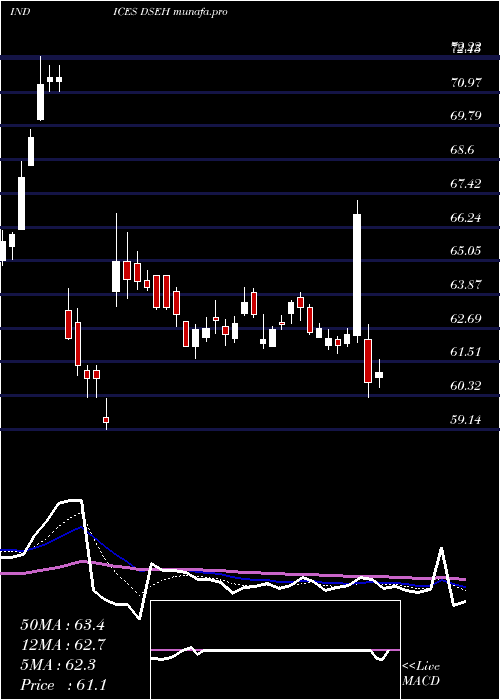
Daily price and volume U S
| Date |
Closing |
Open |
Range |
Volume |
Thu 03 July 2025 |
57.01 (-0.11%) |
56.93 |
56.72 - 57.29 |
0.4056 times |
Wed 02 July 2025 |
57.07 (1.12%) |
56.62 |
55.97 - 57.17 |
0.6934 times |
Tue 01 July 2025 |
56.44 (1.07%) |
55.66 |
55.32 - 56.96 |
0.94 times |
Mon 30 June 2025 |
55.84 (-0.48%) |
56.02 |
54.98 - 56.02 |
1.0833 times |
Fri 27 June 2025 |
56.11 (0.86%) |
55.72 |
55.27 - 56.78 |
1.0326 times |
Thu 26 June 2025 |
55.63 (1.94%) |
54.93 |
54.54 - 55.77 |
0.8296 times |
Wed 25 June 2025 |
54.57 (-3.52%) |
56.30 |
54.37 - 56.40 |
1.1437 times |
Tue 24 June 2025 |
56.56 (2.43%) |
55.65 |
55.38 - 56.65 |
1.089 times |
Mon 23 June 2025 |
55.22 (-3.63%) |
56.34 |
54.00 - 56.61 |
1.8367 times |
Fri 20 June 2025 |
57.30 (-0.17%) |
57.46 |
57.11 - 58.19 |
0.946 times |
Wed 18 June 2025 |
57.40 (0.1%) |
57.34 |
57.31 - 58.03 |
0.612 times |
Weekly price and charts US Strong weekly Stock price targets for US DSEH are 56 and 58.31 | Weekly Target 1 | 54.12 | | Weekly Target 2 | 55.56 | | Weekly Target 3 | 56.426666666667 | | Weekly Target 4 | 57.87 | | Weekly Target 5 | 58.74 |
Weekly price and volumes for U S
| Date |
Closing |
Open |
Range |
Volume |
Thu 03 July 2025 |
57.01 (1.6%) |
56.02 |
54.98 - 57.29 |
0.7855 times |
Fri 27 June 2025 |
56.11 (-2.08%) |
56.34 |
54.00 - 56.78 |
1.4922 times |
Fri 20 June 2025 |
57.30 (-0.17%) |
57.99 |
57.11 - 58.33 |
0.5612 times |
Fri 13 June 2025 |
57.40 (1.09%) |
57.50 |
56.80 - 58.73 |
1.0076 times |
Fri 06 June 2025 |
56.78 (0.48%) |
56.49 |
55.46 - 56.92 |
0.8825 times |
Fri 30 May 2025 |
56.51 (2.5%) |
55.62 |
55.25 - 57.56 |
0.921 times |
Fri 23 May 2025 |
55.13 (-5.7%) |
57.72 |
54.49 - 58.09 |
1.5263 times |
Fri 16 May 2025 |
58.46 (-1.37%) |
60.78 |
58.00 - 61.79 |
1.4002 times |
Tue 13 May 2025 |
59.27 (-2.6%) |
60.98 |
58.84 - 62.20 |
0.9723 times |
Mon 12 May 2025 |
60.85 (2.84%) |
60.98 |
60.74 - 62.20 |
0.4512 times |
Fri 09 May 2025 |
59.17 (6%) |
58.82 |
56.40 - 59.75 |
2.9411 times |

Monthly price and charts US Strong monthly Stock price targets for US DSEH are 56.17 and 58.14 | Monthly Target 1 | 54.57 | | Monthly Target 2 | 55.79 | | Monthly Target 3 | 56.54 | | Monthly Target 4 | 57.76 | | Monthly Target 5 | 58.51 |
Monthly price and volumes U S
| Date |
Closing |
Open |
Range |
Volume |
Thu 03 July 2025 |
57.01 (2.1%) |
55.66 |
55.32 - 57.29 |
0.1552 times |
Mon 30 June 2025 |
55.84 (-1.19%) |
56.49 |
54.00 - 58.73 |
1.2759 times |
Fri 30 May 2025 |
56.51 (2.67%) |
55.18 |
54.49 - 62.20 |
2.5317 times |
Wed 30 April 2025 |
55.04 (-10.18%) |
61.27 |
50.80 - 62.18 |
0.7877 times |
Mon 31 March 2025 |
61.28 (-6.47%) |
64.81 |
59.15 - 65.80 |
0.7312 times |
Fri 28 February 2025 |
65.52 (3.7%) |
62.14 |
59.66 - 67.17 |
1.6888 times |
Fri 31 January 2025 |
63.18 (-11.61%) |
63.29 |
59.14 - 66.71 |
1.0919 times |
Tue 26 November 2024 |
71.48 (13.62%) |
63.34 |
62.04 - 72.22 |
0.6707 times |
Thu 31 October 2024 |
62.91 (-1.8%) |
63.75 |
61.68 - 64.58 |
0.5351 times |
Mon 30 September 2024 |
64.06 (2.94%) |
61.64 |
58.63 - 64.82 |
0.5318 times |
Fri 30 August 2024 |
62.23 (5.89%) |
61.51 |
49.50 - 62.79 |
1.2468 times |

DMA SMA EMA moving averages of U S DSEH
DMA (daily moving average) of U S DSEH
| DMA period | DMA value | | 5 day DMA | 56.49 | | 12 day DMA | 56.37 | | 20 day DMA | 56.72 | | 35 day DMA | 56.82 | | 50 day DMA | 56.97 | | 100 day DMA | 58.75 | | 150 day DMA | 60.75 | | 200 day DMA | 60.96 | EMA (exponential moving average) of U S DSEH
| EMA period | EMA current | EMA prev | EMA prev2 | | 5 day EMA | 56.62 | 56.42 | 56.09 | | 12 day EMA | 56.51 | 56.42 | 56.3 | | 20 day EMA | 56.58 | 56.54 | 56.48 | | 35 day EMA | 56.67 | 56.65 | 56.62 | | 50 day EMA | 56.71 | 56.7 | 56.68 |
SMA (simple moving average) of U S DSEH
| SMA period | SMA current | SMA prev | SMA prev2 | | 5 day SMA | 56.49 | 56.22 | 55.72 | | 12 day SMA | 56.37 | 56.41 | 56.53 | | 20 day SMA | 56.72 | 56.69 | 56.62 | | 35 day SMA | 56.82 | 56.89 | 56.99 | | 50 day SMA | 56.97 | 56.93 | 56.85 | | 100 day SMA | 58.75 | 58.81 | 58.87 | | 150 day SMA | 60.75 | 60.79 | 60.83 | | 200 day SMA | 60.96 | 60.93 | 60.9 |
|
|
