Sml10 975946 full analysis,charts,indicators,moving averages,SMA,DMA,EMA,ADX,MACD,RSISml 10 975946 WideScreen charts, DMA,SMA,EMA technical analysis, forecast prediction, by indicators ADX,MACD,RSI,CCI BSE stock exchange
Daily price and charts and targets Sml10 Strong Daily Stock price targets for Sml10 975946 are 95999 and 95999 | Daily Target 1 | 95999 | | Daily Target 2 | 95999 | | Daily Target 3 | 95999 | | Daily Target 4 | 95999 | | Daily Target 5 | 95999 |
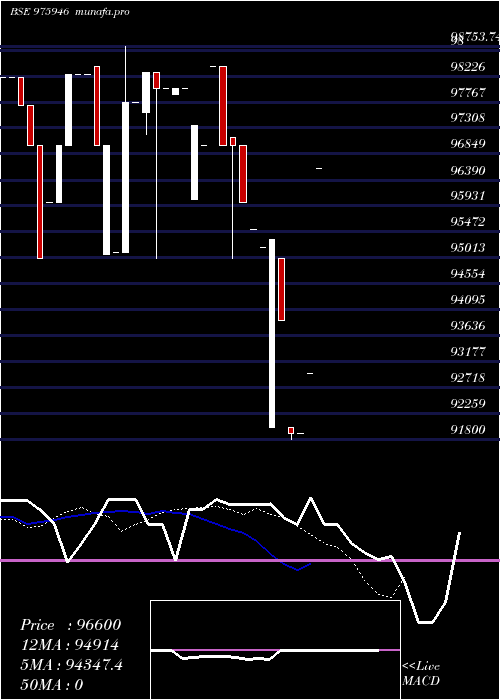
Daily price and volume Sml 10
| Date |
Closing |
Open |
Range |
Volume |
Thu 13 November 2025 |
95999.00 (1.05%) |
95999.00 |
95999.00 - 95999.00 |
0.7143 times |
Fri 07 November 2025 |
95000.00 (0%) |
95000.00 |
95000.00 - 95000.00 |
0.7143 times |
Mon 03 November 2025 |
95000.00 (0%) |
95000.00 |
95000.00 - 95000.00 |
0.7143 times |
Fri 31 October 2025 |
95000.00 (0%) |
95000.00 |
95000.00 - 95000.00 |
0.7143 times |
Thu 30 October 2025 |
94999.00 (4.07%) |
94999.00 |
94999.00 - 94999.00 |
0.7143 times |
Thu 23 October 2025 |
91281.30 (-0.5%) |
91281.30 |
91281.30 - 91281.30 |
2.8571 times |
Tue 14 October 2025 |
91740.00 (-2.6%) |
94185.00 |
91740.00 - 94185.00 |
1.4286 times |
Fri 10 October 2025 |
94185.00 (-2.5%) |
94185.00 |
94185.00 - 94185.00 |
0.7143 times |
Tue 07 October 2025 |
96600.00 (0%) |
96600.00 |
96600.00 - 96600.00 |
0.7143 times |
Thu 18 September 2025 |
96600.00 (3.92%) |
96600.00 |
96600.00 - 96600.00 |
0.7143 times |
Tue 16 September 2025 |
92960.24 (1.15%) |
92960.24 |
92960.24 - 92960.24 |
0.7143 times |
Weekly price and charts Sml10 Strong weekly Stock price targets for Sml10 975946 are 95999 and 95999 | Weekly Target 1 | 95999 | | Weekly Target 2 | 95999 | | Weekly Target 3 | 95999 | | Weekly Target 4 | 95999 | | Weekly Target 5 | 95999 |
Weekly price and volumes for Sml 10
| Date |
Closing |
Open |
Range |
Volume |
Thu 13 November 2025 |
95999.00 (1.05%) |
95999.00 |
95999.00 - 95999.00 |
0.1282 times |
Fri 07 November 2025 |
95000.00 (0%) |
95000.00 |
95000.00 - 95000.00 |
0.2564 times |
Fri 31 October 2025 |
95000.00 (4.07%) |
94999.00 |
94999.00 - 95000.00 |
0.2564 times |
Thu 23 October 2025 |
91281.30 (-3.08%) |
94185.00 |
91281.30 - 94185.00 |
0.7692 times |
Fri 10 October 2025 |
94185.00 (-2.5%) |
96600.00 |
94185.00 - 96600.00 |
0.2564 times |
Thu 18 September 2025 |
96600.00 (5.11%) |
91900.00 |
91900.00 - 96600.00 |
0.5128 times |
Fri 12 September 2025 |
91900.00 (-4.27%) |
95520.00 |
91800.00 - 95520.00 |
1.1538 times |
Fri 05 September 2025 |
96000.00 (-1.03%) |
98400.00 |
95000.00 - 98400.00 |
2.5641 times |
Thu 28 August 2025 |
97000.00 (-1.02%) |
98000.00 |
96040.00 - 98000.00 |
0.641 times |
Fri 22 August 2025 |
98000.00 (0.25%) |
97574.00 |
95001.01 - 98300.00 |
3.4615 times |
Tue 12 August 2025 |
97753.74 (0%) |
97753.74 |
97753.74 - 97753.74 |
0.5128 times |

Monthly price and charts Sml10 Strong monthly Stock price targets for Sml10 975946 are 95499.5 and 96498.5 | Monthly Target 1 | 94667 | | Monthly Target 2 | 95333 | | Monthly Target 3 | 95666 | | Monthly Target 4 | 96332 | | Monthly Target 5 | 96665 |
Monthly price and volumes Sml 10
| Date |
Closing |
Open |
Range |
Volume |
Thu 13 November 2025 |
95999.00 (1.05%) |
95000.00 |
95000.00 - 95999.00 |
0.1593 times |
Fri 31 October 2025 |
95000.00 (-1.66%) |
96600.00 |
91281.30 - 96600.00 |
0.5311 times |
Thu 18 September 2025 |
96600.00 (-0.41%) |
98400.00 |
91800.00 - 98400.00 |
1.7525 times |
Thu 28 August 2025 |
97000.00 (-0.77%) |
97753.74 |
95001.01 - 98300.00 |
1.9118 times |
Thu 31 July 2025 |
97753.74 (-0.45%) |
98200.00 |
95000.00 - 98753.74 |
1.5932 times |
Wed 18 June 2025 |
98200.00 (0%) |
98200.00 |
98200.00 - 98200.00 |
0.0531 times |
Sat 15 November 2025 |
(0%) |
|
- |
0 times |

DMA SMA EMA moving averages of Sml 10 975946
DMA (daily moving average) of Sml 10 975946
| DMA period | DMA value | | 5 day DMA | 95199.6 | | 12 day DMA | 94272.05 | | 20 day DMA | 94656.53 | | 35 day DMA | 95923.64 | | 50 day DMA | | | 100 day DMA | | | 150 day DMA | | | 200 day DMA | | EMA (exponential moving average) of Sml 10 975946
| EMA period | EMA current | EMA prev | EMA prev2 | | 5 day EMA | 95062.15 | 94593.79 | 94390.72 | | 12 day EMA | 94727.96 | 94496.94 | 94405.51 | | 20 day EMA | 94950.92 | 94840.64 | 94823.87 | | 35 day EMA | 95762.72 | 95748.81 | 95792.89 | | 50 day EMA | 0 | 0 | 0 |
SMA (simple moving average) of Sml 10 975946
| SMA period | SMA current | SMA prev | SMA prev2 | | 5 day SMA | 95199.6 | 94256.06 | 93604.06 | | 12 day SMA | 94272.05 | 93930.46 | 93838.8 | | 20 day SMA | 94656.53 | 94776.58 | 94876.58 | | 35 day SMA | 95923.64 | 95988.22 | 96045.36 | | 50 day SMA | | 100 day SMA | | 150 day SMA | | 200 day SMA |
|
|
