Mcsl9 975739 full analysis,charts,indicators,moving averages,SMA,DMA,EMA,ADX,MACD,RSIMcsl 9 975739 WideScreen charts, DMA,SMA,EMA technical analysis, forecast prediction, by indicators ADX,MACD,RSI,CCI BSE stock exchange
Daily price and charts and targets Mcsl9 Strong Daily Stock price targets for Mcsl9 975739 are 99867 and 99867 | Daily Target 1 | 99867 | | Daily Target 2 | 99867 | | Daily Target 3 | 99867 | | Daily Target 4 | 99867 | | Daily Target 5 | 99867 |
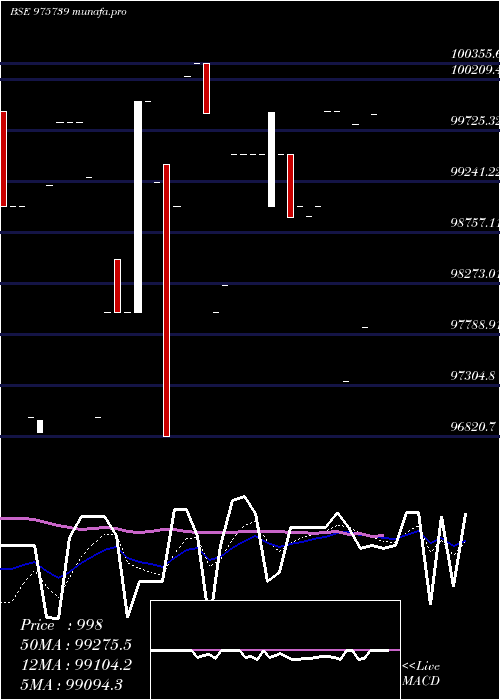
Daily price and volume Mcsl 9
| Date |
Closing |
Open |
Range |
Volume |
Wed 17 December 2025 |
99867.00 (2.05%) |
99867.00 |
99867.00 - 99867.00 |
0.5 times |
Thu 11 December 2025 |
97860.55 (-1.93%) |
97860.55 |
97860.55 - 97860.55 |
1.5 times |
Thu 04 December 2025 |
99785.55 (2.5%) |
99785.45 |
99785.45 - 99785.55 |
1 times |
Fri 14 November 2025 |
97350.85 (-2.55%) |
97350.85 |
97350.85 - 97350.85 |
0.5 times |
Fri 07 November 2025 |
99899.99 (0%) |
99899.99 |
99899.99 - 99899.99 |
1 times |
Tue 04 November 2025 |
99899.99 (0.91%) |
99899.99 |
99899.99 - 99899.99 |
1.5 times |
Mon 03 November 2025 |
99001.00 (0.1%) |
99001.00 |
99001.00 - 99001.00 |
1 times |
Wed 29 October 2025 |
98900.00 (-0.1%) |
98900.00 |
98900.00 - 98900.00 |
0.5 times |
Fri 17 October 2025 |
99000.00 (0.11%) |
99000.00 |
99000.00 - 99000.00 |
0.5 times |
Wed 15 October 2025 |
98894.79 (-0.61%) |
99500.00 |
98894.79 - 99500.00 |
2 times |
Tue 14 October 2025 |
99499.00 (-0.39%) |
99499.00 |
99499.00 - 99499.00 |
1 times |
Weekly price and charts Mcsl9 Strong weekly Stock price targets for Mcsl9 975739 are 99867 and 99867 | Weekly Target 1 | 99867 | | Weekly Target 2 | 99867 | | Weekly Target 3 | 99867 | | Weekly Target 4 | 99867 | | Weekly Target 5 | 99867 |
Weekly price and volumes for Mcsl 9
| Date |
Closing |
Open |
Range |
Volume |
Wed 17 December 2025 |
99867.00 (2.05%) |
99867.00 |
99867.00 - 99867.00 |
0.2703 times |
Thu 11 December 2025 |
97860.55 (-1.93%) |
97860.55 |
97860.55 - 97860.55 |
0.8108 times |
Thu 04 December 2025 |
99785.55 (2.5%) |
99785.45 |
99785.45 - 99785.55 |
0.5405 times |
Fri 14 November 2025 |
97350.85 (-2.55%) |
97350.85 |
97350.85 - 97350.85 |
0.2703 times |
Fri 07 November 2025 |
99899.99 (1.01%) |
99001.00 |
99001.00 - 99899.99 |
1.8919 times |
Wed 29 October 2025 |
98900.00 (-0.1%) |
98900.00 |
98900.00 - 98900.00 |
0.2703 times |
Fri 17 October 2025 |
99000.00 (-0.5%) |
99000.00 |
98894.79 - 99887.00 |
2.4324 times |
Thu 09 October 2025 |
99500.00 (1.27%) |
99500.00 |
99500.00 - 99500.00 |
2.1622 times |
Fri 03 October 2025 |
98252.00 (-1.63%) |
98001.00 |
98001.00 - 98252.00 |
0.5405 times |
Mon 22 September 2025 |
99876.56 (-0.48%) |
100355.00 |
99876.56 - 100355.00 |
0.8108 times |
Fri 19 September 2025 |
100355.65 (1.37%) |
100235.44 |
100235.44 - 100355.65 |
2.1622 times |

Monthly price and charts Mcsl9 Strong monthly Stock price targets for Mcsl9 975739 are 98863.78 and 100870.23 | Monthly Target 1 | 97191.73 | | Monthly Target 2 | 98529.37 | | Monthly Target 3 | 99198.183333333 | | Monthly Target 4 | 100535.82 | | Monthly Target 5 | 101204.63 |
Monthly price and volumes Mcsl 9
| Date |
Closing |
Open |
Range |
Volume |
Wed 17 December 2025 |
99867.00 (2.58%) |
99785.45 |
97860.55 - 99867.00 |
0.2239 times |
Fri 14 November 2025 |
97350.85 (-1.57%) |
99001.00 |
97350.85 - 99899.99 |
0.2985 times |
Wed 29 October 2025 |
98900.00 (0.92%) |
98252.00 |
98252.00 - 99887.00 |
0.709 times |
Mon 29 September 2025 |
98001.00 (-1.24%) |
99392.00 |
96820.70 - 100355.65 |
1.2687 times |
Fri 29 August 2025 |
99233.35 (1.26%) |
98501.00 |
98000.00 - 100000.00 |
1.1567 times |
Wed 30 July 2025 |
98001.00 (-1.8%) |
99793.00 |
97000.00 - 99793.00 |
0.4851 times |
Mon 23 June 2025 |
99793.00 (0.8%) |
99000.00 |
96866.35 - 99793.00 |
1.1194 times |
Tue 27 May 2025 |
99000.01 (0%) |
85000.00 |
85000.00 - 109000.00 |
1.6418 times |
Mon 28 April 2025 |
99000.00 (-1%) |
99000.00 |
98000.01 - 99535.25 |
0.6716 times |
Fri 28 March 2025 |
99999.99 (-0%) |
99000.00 |
85000.00 - 110000.00 |
2.4254 times |
Fri 21 February 2025 |
100000.00 (-3.55%) |
95001.02 |
95001.02 - 100000.00 |
2.1642 times |

DMA SMA EMA moving averages of Mcsl 9 975739
DMA (daily moving average) of Mcsl 9 975739
| DMA period | DMA value | | 5 day DMA | 98952.79 | | 12 day DMA | 99153.81 | | 20 day DMA | 99216.55 | | 35 day DMA | 99099.46 | | 50 day DMA | 98946.14 | | 100 day DMA | | | 150 day DMA | | | 200 day DMA | | EMA (exponential moving average) of Mcsl 9 975739
| EMA period | EMA current | EMA prev | EMA prev2 | | 5 day EMA | 99094.33 | 98708.05 | 99131.74 | | 12 day EMA | 99103.79 | 98965.07 | 99165.82 | | 20 day EMA | 99111.06 | 99031.52 | 99154.72 | | 35 day EMA | 99059.54 | 99012 | 99079.79 | | 50 day EMA | 98960.18 | 98923.18 | 98966.53 |
SMA (simple moving average) of Mcsl 9 975739
| SMA period | SMA current | SMA prev | SMA prev2 | | 5 day SMA | 98952.79 | 98959.39 | 99187.48 | | 12 day SMA | 99153.81 | 99123.23 | 99259.85 | | 20 day SMA | 99216.55 | 99234.97 | 99291.94 | | 35 day SMA | 99099.46 | 99016.64 | 98992.08 | | 50 day SMA | 98946.14 | 98908.8 | 98941.58 | | 100 day SMA | | 150 day SMA | | 200 day SMA |
|
|
