0msfl26 975454 full analysis,charts,indicators,moving averages,SMA,DMA,EMA,ADX,MACD,RSI0msfl26 975454 WideScreen charts, DMA,SMA,EMA technical analysis, forecast prediction, by indicators ADX,MACD,RSI,CCI BSE stock exchange
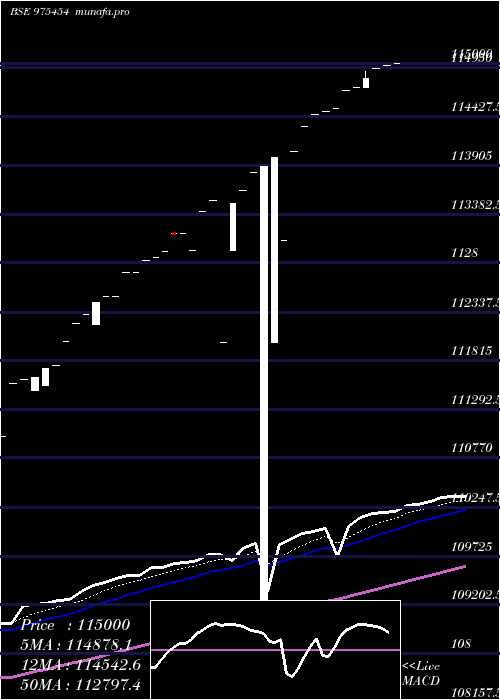
Daily price and charts and targets 0msfl26 Strong Daily Stock price targets for 0msfl26 975454 are 120613.5 and 120648.5 | Daily Target 1 | 120584.33 | | Daily Target 2 | 120607.67 | | Daily Target 3 | 120619.33333333 | | Daily Target 4 | 120642.67 | | Daily Target 5 | 120654.33 |
Daily price and volume 0msfl26
| Date |
Closing |
Open |
Range |
Volume |
Wed 17 December 2025 |
120631.00 (0.03%) |
120596.00 |
120596.00 - 120631.00 |
0.2954 times |
Tue 16 December 2025 |
120596.00 (0.03%) |
120596.00 |
120596.00 - 120596.00 |
0.384 times |
Mon 15 December 2025 |
120562.00 (0.09%) |
120562.00 |
120562.00 - 120562.00 |
0.192 times |
Fri 12 December 2025 |
120458.00 (0.09%) |
120458.00 |
120458.00 - 120458.00 |
0.0295 times |
Tue 09 December 2025 |
120355.00 (0.17%) |
120355.00 |
120355.00 - 120355.00 |
3.7223 times |
Wed 03 December 2025 |
120149.00 (0.06%) |
120149.00 |
120000.00 - 120149.00 |
0.0443 times |
Mon 01 December 2025 |
120080.00 (0.49%) |
120080.00 |
120000.00 - 120080.00 |
0.3102 times |
Wed 26 November 2025 |
119500.00 (0.09%) |
119500.00 |
119395.00 - 119500.00 |
0.0443 times |
Tue 11 November 2025 |
119395.00 (0.03%) |
119395.00 |
119395.00 - 119395.00 |
0.2659 times |
Mon 10 November 2025 |
119361.00 (0.11%) |
119361.00 |
119361.00 - 119361.00 |
4.712 times |
Thu 06 November 2025 |
119225.00 (0.06%) |
119157.00 |
119157.00 - 119225.00 |
0.2363 times |
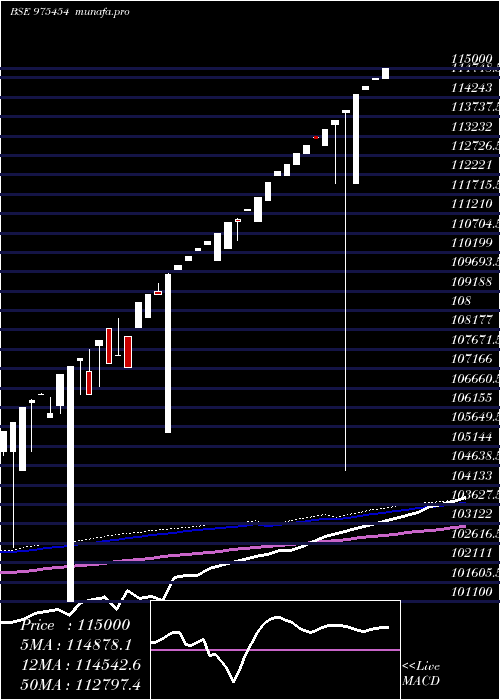
Weekly price and charts 0msfl26 Strong weekly Stock price targets for 0msfl26 975454 are 120596.5 and 120665.5 | Weekly Target 1 | 120539 | | Weekly Target 2 | 120585 | | Weekly Target 3 | 120608 | | Weekly Target 4 | 120654 | | Weekly Target 5 | 120677 |
Weekly price and volumes for 0msfl26
| Date |
Closing |
Open |
Range |
Volume |
Wed 17 December 2025 |
120631.00 (0.14%) |
120562.00 |
120562.00 - 120631.00 |
0.4638 times |
Fri 12 December 2025 |
120458.00 (0.26%) |
120355.00 |
120355.00 - 120458.00 |
1.9969 times |
Wed 03 December 2025 |
120149.00 (0.54%) |
120080.00 |
120000.00 - 120149.00 |
0.1887 times |
Wed 26 November 2025 |
119500.00 (0.23%) |
119361.00 |
119361.00 - 119500.00 |
2.673 times |
Thu 06 November 2025 |
119225.00 (0.2%) |
119122.00 |
119122.00 - 119225.00 |
2.1541 times |
Thu 30 October 2025 |
118986.00 (0.37%) |
118918.00 |
118918.00 - 118986.00 |
0.6447 times |
Fri 17 October 2025 |
118545.00 (0.41%) |
118206.00 |
118206.00 - 118545.00 |
1.3522 times |
Fri 03 October 2025 |
118060.44 (0.21%) |
117997.00 |
117997.00 - 118071.00 |
0.1965 times |
Fri 26 September 2025 |
117817.00 (0.21%) |
117719.00 |
117719.00 - 117817.00 |
0.1101 times |
Thu 18 September 2025 |
117566.00 (0.49%) |
117230.00 |
116700.00 - 117566.00 |
0.2201 times |
Thu 04 September 2025 |
116991.00 (0.08%) |
116992.00 |
116991.00 - 116992.00 |
0.2437 times |
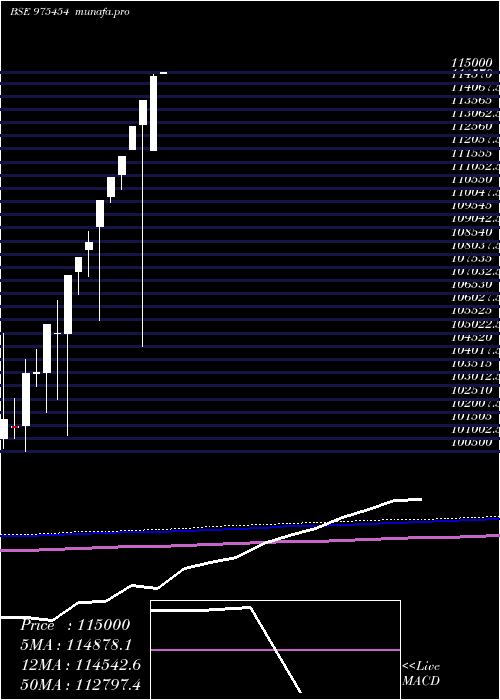
Monthly price and charts 0msfl26 Strong monthly Stock price targets for 0msfl26 975454 are 120315.5 and 120946.5 | Monthly Target 1 | 119789.67 | | Monthly Target 2 | 120210.33 | | Monthly Target 3 | 120420.66666667 | | Monthly Target 4 | 120841.33 | | Monthly Target 5 | 121051.67 |
Monthly price and volumes 0msfl26
| Date |
Closing |
Open |
Range |
Volume |
Wed 17 December 2025 |
120631.00 (0.95%) |
120080.00 |
120000.00 - 120631.00 |
1.1332 times |
Wed 26 November 2025 |
119500.00 (0.43%) |
119122.00 |
119122.00 - 119500.00 |
2.0646 times |
Thu 30 October 2025 |
118986.00 (0.99%) |
117997.00 |
117997.00 - 118986.00 |
0.9381 times |
Fri 26 September 2025 |
117817.00 (0.79%) |
116992.00 |
116700.00 - 117817.00 |
0.2455 times |
Fri 29 August 2025 |
116892.57 (0.87%) |
115889.00 |
114000.00 - 116896.00 |
1.5938 times |
Wed 30 July 2025 |
115889.00 (0.93%) |
114940.00 |
114100.00 - 115897.00 |
0.9449 times |
Mon 30 June 2025 |
114825.00 (0.82%) |
112000.00 |
112000.00 - 114907.00 |
0.5884 times |
Fri 30 May 2025 |
113893.00 (0.86%) |
112985.00 |
104500.00 - 113893.00 |
1.0457 times |
Wed 30 April 2025 |
112921.00 (1.04%) |
112020.00 |
112020.00 - 112921.00 |
0.6321 times |
Tue 25 March 2025 |
111764.00 (0.72%) |
111063.00 |
110500.00 - 111764.00 |
0.8137 times |
Fri 28 February 2025 |
110968.00 (0.8%) |
110241.00 |
110000.00 - 110968.00 |
0.9482 times |
DMA SMA EMA moving averages of 0msfl26 975454
DMA (daily moving average) of 0msfl26 975454
| DMA period | DMA value | | 5 day DMA | 120520.4 | | 12 day DMA | 119955.75 | | 20 day DMA | 119380.02 | | 35 day DMA | 118200.33 | | 50 day DMA | 117299.19 | | 100 day DMA | 114840.5 | | 150 day DMA | 112543.21 | | 200 day DMA | 110489.78 | EMA (exponential moving average) of 0msfl26 975454
| EMA period | EMA current | EMA prev | EMA prev2 | | 5 day EMA | 120463.35 | 120379.54 | 120271.32 | | 12 day EMA | 119969.12 | 119848.82 | 119713.02 | | 20 day EMA | 119394.77 | 119264.7 | 119124.62 | | 35 day EMA | 118403.87 | 118272.75 | 118135.97 | | 50 day EMA | 117397.5 | 117265.58 | 117129.7 |
SMA (simple moving average) of 0msfl26 975454
| SMA period | SMA current | SMA prev | SMA prev2 | | 5 day SMA | 120520.4 | 120424 | 120320.8 | | 12 day SMA | 119955.75 | 119830 | 119695.83 | | 20 day SMA | 119380.02 | 119234.42 | 119082.92 | | 35 day SMA | 118200.33 | 118042.3 | 117907.82 | | 50 day SMA | 117299.19 | 117181.43 | 117063.71 | | 100 day SMA | 114840.5 | 114737.23 | 114633.99 | | 150 day SMA | 112543.21 | 112448.95 | 112353.97 | | 200 day SMA | 110489.78 | 110402.75 | 110315.6 |
|
|
