1350tcl27 975331 full analysis,charts,indicators,moving averages,SMA,DMA,EMA,ADX,MACD,RSI1350tcl27 975331 WideScreen charts, DMA,SMA,EMA technical analysis, forecast prediction, by indicators ADX,MACD,RSI,CCI BSE stock exchange
Daily price and charts and targets 1350tcl27 Strong Daily Stock price targets for 1350tcl27 975331 are 50900 and 50900 | Daily Target 1 | 50900 | | Daily Target 2 | 50900 | | Daily Target 3 | 50900 | | Daily Target 4 | 50900 | | Daily Target 5 | 50900 |
Daily price and volume 1350tcl27
| Date |
Closing |
Open |
Range |
Volume |
Fri 19 December 2025 |
50900.00 (1.59%) |
50900.00 |
50900.00 - 50900.00 |
0.9524 times |
Wed 17 December 2025 |
50101.00 (-0.72%) |
50502.00 |
50101.00 - 50502.01 |
3.0952 times |
Mon 15 December 2025 |
50462.42 (-0.5%) |
50716.00 |
50462.42 - 50716.00 |
0.4762 times |
Fri 12 December 2025 |
50716.00 (-1.95%) |
50716.00 |
50716.00 - 50716.00 |
0.2381 times |
Thu 11 December 2025 |
51724.81 (1.53%) |
50500.00 |
50500.00 - 51724.81 |
0.7143 times |
Wed 10 December 2025 |
50944.81 (0.78%) |
50944.81 |
50944.81 - 50944.81 |
0.2381 times |
Tue 09 December 2025 |
50550.00 (0.09%) |
50450.00 |
50450.00 - 50550.00 |
0.7143 times |
Mon 08 December 2025 |
50502.11 (-0.29%) |
50502.11 |
50502.11 - 50502.11 |
0.2381 times |
Fri 05 December 2025 |
50650.00 (-0.12%) |
50650.00 |
50650.00 - 50650.00 |
1.1905 times |
Thu 04 December 2025 |
50713.05 (0.03%) |
50501.00 |
50500.00 - 50713.05 |
2.1429 times |
Mon 01 December 2025 |
50700.00 (-0.59%) |
50700.00 |
50700.00 - 50700.00 |
0.9524 times |
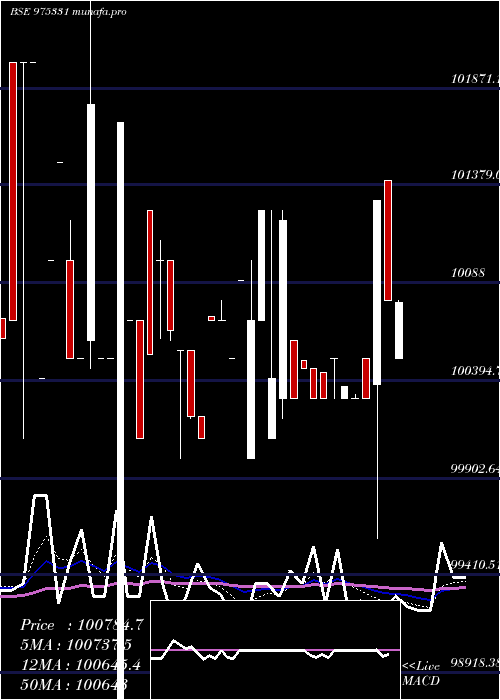
Weekly price and charts 1350tcl27 Strong weekly Stock price targets for 1350tcl27 975331 are 50500.5 and 51299.5 | Weekly Target 1 | 49834.67 | | Weekly Target 2 | 50367.33 | | Weekly Target 3 | 50633.666666667 | | Weekly Target 4 | 51166.33 | | Weekly Target 5 | 51432.67 |
Weekly price and volumes for 1350tcl27
| Date |
Closing |
Open |
Range |
Volume |
Fri 19 December 2025 |
50900.00 (0.36%) |
50716.00 |
50101.00 - 50900.00 |
1.2025 times |
Fri 12 December 2025 |
50716.00 (0.13%) |
50502.11 |
50450.00 - 51724.81 |
0.5696 times |
Fri 05 December 2025 |
50650.00 (-0.69%) |
50700.00 |
50500.00 - 50713.05 |
1.1392 times |
Fri 28 November 2025 |
51000.00 (0.49%) |
50750.00 |
50261.00 - 51300.00 |
1.0759 times |
Fri 21 November 2025 |
50750.00 (-0.78%) |
51075.00 |
50500.00 - 51899.00 |
0.8228 times |
Thu 13 November 2025 |
51150.00 (-0.1%) |
51210.00 |
51100.00 - 51592.15 |
0.6329 times |
Fri 07 November 2025 |
51200.00 (-0.1%) |
52000.00 |
51000.01 - 52000.00 |
0.6329 times |
Fri 31 October 2025 |
51250.00 (-1.06%) |
52000.00 |
51000.00 - 52290.00 |
1.5823 times |
Thu 23 October 2025 |
51799.00 (-0.86%) |
52250.00 |
51700.00 - 52250.00 |
0.5063 times |
Fri 17 October 2025 |
52250.00 (0.48%) |
51500.00 |
51011.00 - 52999.00 |
1.8354 times |
Fri 10 October 2025 |
51999.00 (1.32%) |
51320.20 |
50900.00 - 53000.00 |
2.0253 times |
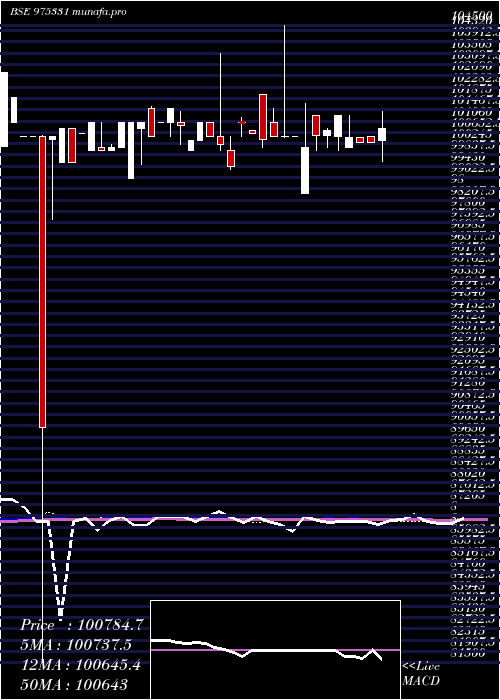
Monthly price and charts 1350tcl27 Strong monthly Stock price targets for 1350tcl27 975331 are 50500.5 and 52124.31 | Monthly Target 1 | 49284.79 | | Monthly Target 2 | 50092.4 | | Monthly Target 3 | 50908.603333333 | | Monthly Target 4 | 51716.21 | | Monthly Target 5 | 52532.41 |
Monthly price and volumes 1350tcl27
| Date |
Closing |
Open |
Range |
Volume |
Fri 19 December 2025 |
50900.00 (-0.2%) |
50700.00 |
50101.00 - 51724.81 |
0.4244 times |
Fri 28 November 2025 |
51000.00 (-0.49%) |
52000.00 |
50261.00 - 52000.00 |
0.4613 times |
Fri 31 October 2025 |
51250.00 (-5.96%) |
53800.00 |
50900.00 - 55500.00 |
1.1531 times |
Tue 30 September 2025 |
54500.00 (-46.81%) |
100601.00 |
51001.00 - 103054.00 |
2.1863 times |
Fri 29 August 2025 |
102455.65 (0.76%) |
100000.00 |
100000.00 - 103020.45 |
0.6181 times |
Thu 31 July 2025 |
101680.00 (0.57%) |
101150.00 |
100655.00 - 102490.00 |
0.8764 times |
Mon 30 June 2025 |
101100.00 (-0.33%) |
101100.00 |
100360.00 - 102800.00 |
1.0424 times |
Fri 30 May 2025 |
101430.00 (-0.07%) |
100910.55 |
100000.00 - 102995.00 |
1.7066 times |
Thu 24 April 2025 |
101499.00 (1.19%) |
100370.00 |
99600.00 - 103000.55 |
0.5812 times |
Fri 28 March 2025 |
100301.00 (-0.4%) |
100500.00 |
100000.00 - 101250.00 |
0.9502 times |
Fri 28 February 2025 |
100701.00 (0.2%) |
98426.25 |
98426.25 - 101700.00 |
0.655 times |

DMA SMA EMA moving averages of 1350tcl27 975331
DMA (daily moving average) of 1350tcl27 975331
| DMA period | DMA value | | 5 day DMA | 50780.85 | | 12 day DMA | 50747.02 | | 20 day DMA | 50787.64 | | 35 day DMA | 51093.86 | | 50 day DMA | 51734.53 | | 100 day DMA | 76628.05 | | 150 day DMA | 84810.35 | | 200 day DMA | 88791.47 | EMA (exponential moving average) of 1350tcl27 975331
| EMA period | EMA current | EMA prev | EMA prev2 | | 5 day EMA | 50670.52 | 50555.8 | 50783.16 | | 12 day EMA | 50760.06 | 50734.63 | 50849.79 | | 20 day EMA | 51249.9 | 51286.72 | 51411.48 | | 35 day EMA | 53519.26 | 53673.46 | 53883.78 | | 50 day EMA | 55734.24 | 55931.47 | 56169.35 |
SMA (simple moving average) of 1350tcl27 975331
| SMA period | SMA current | SMA prev | SMA prev2 | | 5 day SMA | 50780.85 | 50789.81 | 50879.61 | | 12 day SMA | 50747.02 | 50713.68 | 50767.77 | | 20 day SMA | 50787.64 | 50803.14 | 50858.09 | | 35 day SMA | 51093.86 | 51102.43 | 51128.11 | | 50 day SMA | 51734.53 | 52736.57 | 53762.54 | | 100 day SMA | 76628.05 | 77143.04 | 77650.23 | | 150 day SMA | 84810.35 | 85145.68 | 85481.02 | | 200 day SMA | 88791.47 | 89042.02 | 89299.01 |
|
|
