1011ssfl25 975252 full analysis,charts,indicators,moving averages,SMA,DMA,EMA,ADX,MACD,RSI1011ssfl25 975252 WideScreen charts, DMA,SMA,EMA technical analysis, forecast prediction, by indicators ADX,MACD,RSI,CCI BSE stock exchange
Daily price and charts and targets 1011ssfl25 Strong Daily Stock price targets for 1011ssfl25 975252 are 100900 and 100900 | Daily Target 1 | 100900 | | Daily Target 2 | 100900 | | Daily Target 3 | 100900 | | Daily Target 4 | 100900 | | Daily Target 5 | 100900 |
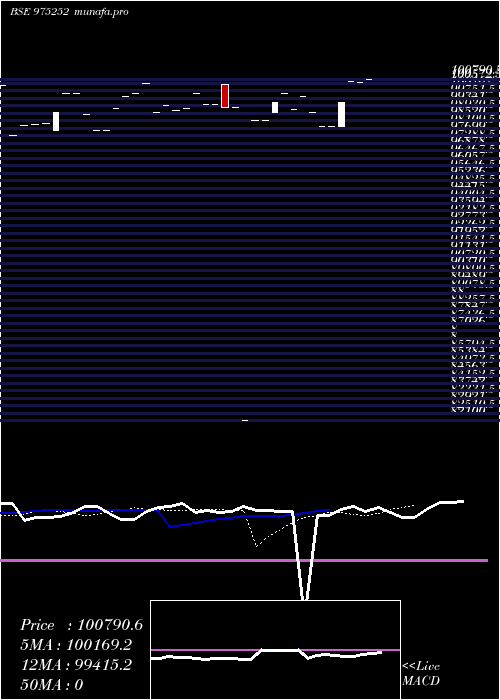
Daily price and volume 1011ssfl25
| Date |
Closing |
Open |
Range |
Volume |
Fri 21 November 2025 |
100900.00 (0.1%) |
100900.00 |
100900.00 - 100900.00 |
0.3448 times |
Thu 20 November 2025 |
100800.00 (-0.2%) |
100800.00 |
100800.00 - 100800.00 |
0.6897 times |
Tue 18 November 2025 |
100999.33 (2.02%) |
100998.99 |
100998.99 - 101000.00 |
1.7241 times |
Mon 10 November 2025 |
99000.00 (0.47%) |
98537.84 |
98500.00 - 99000.00 |
1.3793 times |
Fri 31 October 2025 |
98537.84 (-0.5%) |
98537.84 |
98537.84 - 98537.84 |
0.3448 times |
Tue 28 October 2025 |
99033.00 (-0.17%) |
99198.00 |
99000.00 - 99198.00 |
2.069 times |
Mon 27 October 2025 |
99198.00 (1.72%) |
99000.00 |
99000.00 - 99200.00 |
1.3793 times |
Mon 13 October 2025 |
97520.35 (-0.1%) |
98000.00 |
97520.35 - 98000.00 |
1.0345 times |
Mon 29 September 2025 |
97620.45 (-0.89%) |
98620.35 |
97620.45 - 98620.35 |
0.6897 times |
Fri 26 September 2025 |
98500.00 (-0.02%) |
98500.00 |
98500.00 - 98500.00 |
0.3448 times |
Thu 25 September 2025 |
98520.45 (-0.48%) |
98520.45 |
98520.45 - 98520.45 |
0.3448 times |
Weekly price and charts 1011ssfl25 Strong weekly Stock price targets for 1011ssfl25 975252 are 99700 and 102200 | Weekly Target 1 | 97633.33 | | Weekly Target 2 | 99266.67 | | Weekly Target 3 | 100133.33333333 | | Weekly Target 4 | 101766.67 | | Weekly Target 5 | 102633.33 |
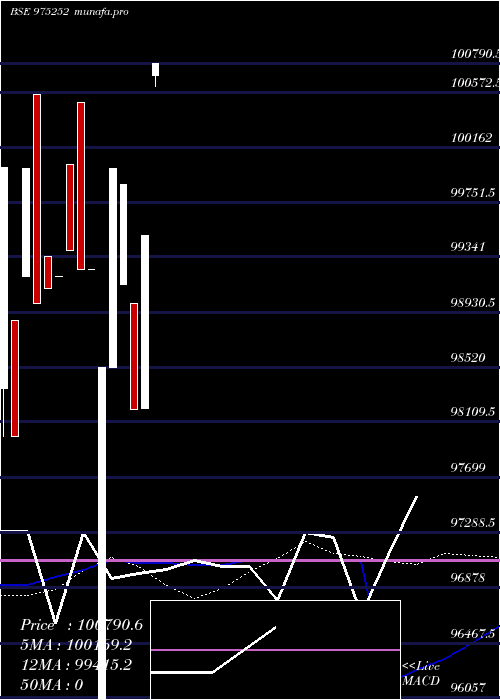
Weekly price and volumes for 1011ssfl25
| Date |
Closing |
Open |
Range |
Volume |
Fri 21 November 2025 |
100900.00 (2.4%) |
98537.84 |
98500.00 - 101000.00 |
2.5 times |
Fri 31 October 2025 |
98537.84 (1.04%) |
99000.00 |
98537.84 - 99200.00 |
2.2917 times |
Mon 13 October 2025 |
97520.35 (-0.1%) |
98000.00 |
97520.35 - 98000.00 |
0.625 times |
Mon 29 September 2025 |
97620.45 (-0.89%) |
98620.35 |
97620.45 - 98620.35 |
0.4167 times |
Fri 26 September 2025 |
98500.00 (0.46%) |
99000.00 |
98500.00 - 99000.00 |
0.625 times |
Thu 18 September 2025 |
98046.97 (13.34%) |
99055.55 |
97500.00 - 99055.55 |
1.0417 times |
Tue 09 September 2025 |
86510.45 (-13.92%) |
86510.45 |
86510.45 - 86510.45 |
0.2083 times |
Tue 02 September 2025 |
100500.00 (-0.45%) |
100800.00 |
100500.00 - 100800.00 |
0.625 times |
Thu 21 August 2025 |
100955.00 (1.97%) |
99820.35 |
99820.35 - 100955.00 |
1.4583 times |
Wed 23 July 2025 |
99000.00 (-0.9%) |
99000.00 |
99000.00 - 99000.00 |
0.2083 times |
Thu 17 July 2025 |
99899.00 (1.94%) |
98001.90 |
98001.90 - 99899.00 |
0.625 times |
Monthly price and charts 1011ssfl25 Strong monthly Stock price targets for 1011ssfl25 975252 are 99700 and 102200 | Monthly Target 1 | 97633.33 | | Monthly Target 2 | 99266.67 | | Monthly Target 3 | 100133.33333333 | | Monthly Target 4 | 101766.67 | | Monthly Target 5 | 102633.33 |
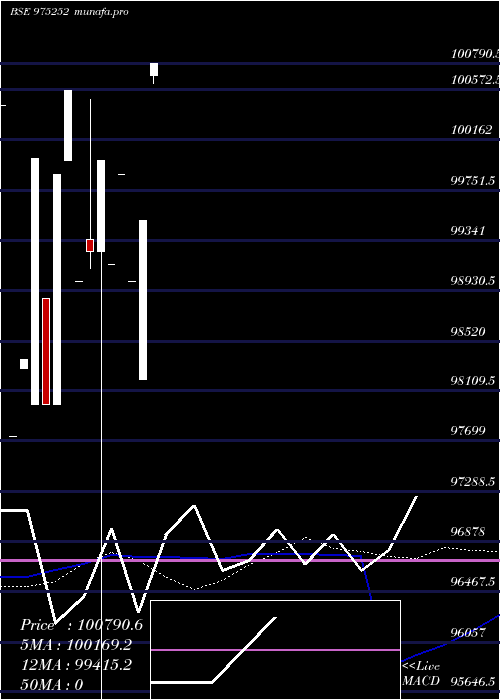
Monthly price and volumes 1011ssfl25
| Date |
Closing |
Open |
Range |
Volume |
Fri 21 November 2025 |
100900.00 (2.4%) |
98537.84 |
98500.00 - 101000.00 |
1.6438 times |
Fri 31 October 2025 |
98537.84 (0.94%) |
98000.00 |
97520.35 - 99200.00 |
1.9178 times |
Mon 29 September 2025 |
97620.45 (-3.3%) |
100800.00 |
86510.45 - 100800.00 |
1.9178 times |
Thu 21 August 2025 |
100955.00 (1.97%) |
99820.35 |
99820.35 - 100955.00 |
0.9589 times |
Wed 23 July 2025 |
99000.00 (-1.78%) |
98050.00 |
98001.90 - 99899.00 |
1.2329 times |
Fri 16 May 2025 |
100790.55 (1.3%) |
100695.45 |
100620.00 - 100790.55 |
0.411 times |
Thu 24 April 2025 |
99500.00 (0.51%) |
98200.00 |
98200.00 - 99500.00 |
0.8219 times |
Tue 18 February 2025 |
99000.00 (-0.88%) |
99000.00 |
99000.00 - 99000.00 |
0.6849 times |
Thu 30 January 2025 |
99879.07 (0.75%) |
99879.07 |
99879.07 - 99879.07 |
0.137 times |
Tue 31 December 2024 |
99139.08 (-0.86%) |
99139.08 |
99139.08 - 99139.08 |
0.274 times |
Fri 22 November 2024 |
100000.00 (0.75%) |
99250.94 |
82100.00 - 100000.00 |
2.7397 times |
DMA SMA EMA moving averages of 1011ssfl25 975252
DMA (daily moving average) of 1011ssfl25 975252
| DMA period | DMA value | | 5 day DMA | 100047.43 | | 12 day DMA | 99135.79 | | 20 day DMA | 98742.37 | | 35 day DMA | 99007.81 | | 50 day DMA | 98776.57 | | 100 day DMA | | | 150 day DMA | | | 200 day DMA | | EMA (exponential moving average) of 1011ssfl25 975252
| EMA period | EMA current | EMA prev | EMA prev2 | | 5 day EMA | 100238.86 | 99908.34 | 99462.57 | | 12 day EMA | 99433.48 | 99166.93 | 98870.11 | | 20 day EMA | 99129.41 | 98943.12 | 98747.75 | | 35 day EMA | 98896.23 | 98778.26 | 98659.23 | | 50 day EMA | 98915.23 | 98834.25 | 98754.05 |
SMA (simple moving average) of 1011ssfl25 975252
| SMA period | SMA current | SMA prev | SMA prev2 | | 5 day SMA | 100047.43 | 99674.03 | 99353.63 | | 12 day SMA | 99135.79 | 98898.03 | 98752.66 | | 20 day SMA | 98742.37 | 98692.32 | 98602.27 | | 35 day SMA | 99007.81 | 98939.81 | 98874.67 | | 50 day SMA | 98776.57 | 98742.44 | 98686.44 | | 100 day SMA | | 150 day SMA | | 200 day SMA |
|
|
