11scnl26 975154 full analysis,charts,indicators,moving averages,SMA,DMA,EMA,ADX,MACD,RSI11scnl26 975154 WideScreen charts, DMA,SMA,EMA technical analysis, forecast prediction, by indicators ADX,MACD,RSI,CCI BSE stock exchange
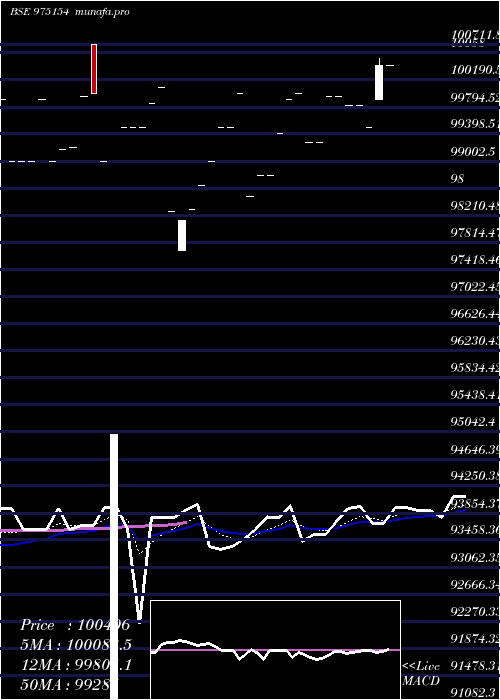
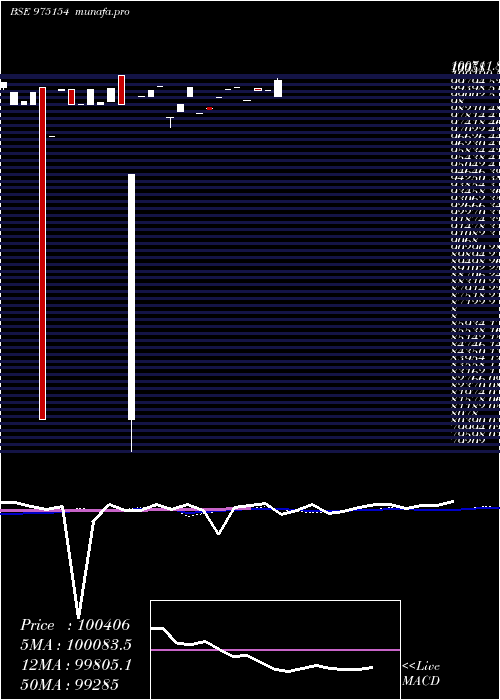
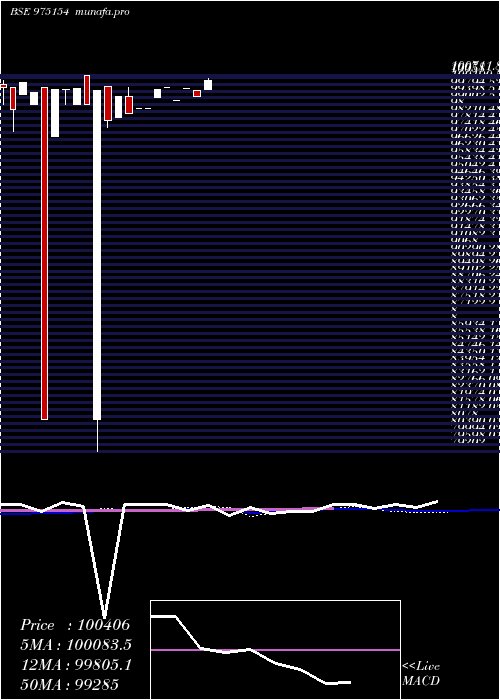
Daily price and charts and targets 11scnl26 Strong Daily Stock price targets for 11scnl26 975154 are 99849 and 99849 | Daily Target 1 | 99849 | | Daily Target 2 | 99849 | | Daily Target 3 | 99849 | | Daily Target 4 | 99849 | | Daily Target 5 | 99849 |
Daily price and volume 11scnl26
| Date |
Closing |
Open |
Range |
Volume |
Tue 16 December 2025 |
99849.00 (0.02%) |
99849.00 |
99849.00 - 99849.00 |
0.3333 times |
Mon 15 December 2025 |
99829.00 (0.33%) |
99829.00 |
99829.00 - 99829.00 |
0.6667 times |
Thu 11 December 2025 |
99499.00 (0%) |
99499.00 |
99499.00 - 99499.00 |
1 times |
Mon 08 December 2025 |
99499.00 (1.51%) |
99600.00 |
99499.00 - 99690.55 |
2 times |
Tue 02 December 2025 |
98021.00 (-2.53%) |
98021.00 |
98021.00 - 98021.00 |
0.6667 times |
Tue 18 November 2025 |
100560.55 (0%) |
100560.55 |
100560.55 - 100560.55 |
1 times |
Mon 08 September 2025 |
100560.55 (0.56%) |
100560.55 |
100560.55 - 100560.55 |
0.3333 times |
Mon 01 September 2025 |
99999.00 (0%) |
99999.00 |
99999.00 - 99999.00 |
0.3333 times |
Wed 20 August 2025 |
99999.00 (0.55%) |
99999.00 |
99999.00 - 99999.00 |
3.3333 times |
Wed 13 August 2025 |
99450.25 (-0.5%) |
99450.25 |
99450.25 - 99450.25 |
0.3333 times |
Fri 08 August 2025 |
99950.00 (1.82%) |
99966.33 |
99950.00 - 99966.33 |
1 times |
Weekly price and charts 11scnl26 Strong weekly Stock price targets for 11scnl26 975154 are 99839 and 99859 | Weekly Target 1 | 99822.33 | | Weekly Target 2 | 99835.67 | | Weekly Target 3 | 99842.333333333 | | Weekly Target 4 | 99855.67 | | Weekly Target 5 | 99862.33 |
Weekly price and volumes for 11scnl26
| Date |
Closing |
Open |
Range |
Volume |
Tue 16 December 2025 |
99849.00 (0.35%) |
99829.00 |
99829.00 - 99849.00 |
0.4918 times |
Thu 11 December 2025 |
99499.00 (1.51%) |
99600.00 |
99499.00 - 99690.55 |
1.4754 times |
Tue 02 December 2025 |
98021.00 (-2.53%) |
98021.00 |
98021.00 - 98021.00 |
0.3279 times |
Tue 18 November 2025 |
100560.55 (0.56%) |
100560.55 |
100560.55 - 100560.55 |
0.6557 times |
Mon 01 September 2025 |
99999.00 (0%) |
99999.00 |
99999.00 - 99999.00 |
0.1639 times |
Wed 20 August 2025 |
99999.00 (0.55%) |
99999.00 |
99999.00 - 99999.00 |
1.6393 times |
Wed 13 August 2025 |
99450.25 (-0.5%) |
99450.25 |
99450.25 - 99450.25 |
0.1639 times |
Fri 08 August 2025 |
99950.00 (0%) |
99512.50 |
98160.45 - 99966.33 |
1.9672 times |
Tue 22 July 2025 |
99950.00 (-0.15%) |
99950.00 |
99950.00 - 99950.00 |
0.8197 times |
Thu 17 July 2025 |
100099.00 (-0.31%) |
99769.42 |
99769.42 - 100099.00 |
2.2951 times |
Thu 03 July 2025 |
100406.00 (0.58%) |
99500.00 |
99500.00 - 100499.00 |
3.4426 times |
Monthly price and charts 11scnl26 Strong monthly Stock price targets for 11scnl26 975154 are 98935 and 100763 | Monthly Target 1 | 97411.67 | | Monthly Target 2 | 98630.33 | | Monthly Target 3 | 99239.666666667 | | Monthly Target 4 | 100458.33 | | Monthly Target 5 | 101067.67 |
Monthly price and volumes 11scnl26
| Date |
Closing |
Open |
Range |
Volume |
Tue 16 December 2025 |
99849.00 (-0.71%) |
98021.00 |
98021.00 - 99849.00 |
1.25 times |
Tue 18 November 2025 |
100560.55 (0%) |
100560.55 |
100560.55 - 100560.55 |
0.2679 times |
Mon 08 September 2025 |
100560.55 (0.56%) |
99999.00 |
99999.00 - 100560.55 |
0.1786 times |
Wed 20 August 2025 |
99999.00 (0.49%) |
98160.45 |
98160.45 - 99999.00 |
1.5179 times |
Tue 29 July 2025 |
99512.50 (0.01%) |
99900.00 |
99512.50 - 100499.00 |
4.0179 times |
Mon 19 May 2025 |
99500.00 (-0.45%) |
99813.01 |
99500.00 - 99825.00 |
0.9821 times |
Wed 30 April 2025 |
99950.00 (0.68%) |
99950.00 |
99950.00 - 99950.00 |
0.5357 times |
Tue 11 March 2025 |
99271.73 (-0.73%) |
99271.73 |
99271.73 - 99271.73 |
0.8929 times |
Mon 03 February 2025 |
100000.00 (0.1%) |
100000.00 |
100000.00 - 100000.00 |
0.1786 times |
Wed 29 January 2025 |
99900.00 (1.11%) |
99401.00 |
99401.00 - 99900.00 |
0.1786 times |
Thu 05 December 2024 |
98799.00 (-0%) |
98799.00 |
98799.00 - 98799.00 |
0.2679 times |
DMA SMA EMA moving averages of 11scnl26 975154
DMA (daily moving average) of 11scnl26 975154
| DMA period | DMA value | | 5 day DMA | 99339.4 | | 12 day DMA | 99614.73 | | 20 day DMA | 99750.94 | | 35 day DMA | 99642.38 | | 50 day DMA | 99428.04 | | 100 day DMA | | | 150 day DMA | | | 200 day DMA | | EMA (exponential moving average) of 11scnl26 975154
| EMA period | EMA current | EMA prev | EMA prev2 | | 5 day EMA | 99685.23 | 99603.35 | 99490.54 | | 12 day EMA | 99677.02 | 99645.76 | 99612.45 | | 20 day EMA | 99665.96 | 99646.7 | 99627.52 | | 35 day EMA | 99556.74 | 99539.53 | 99522.49 | | 50 day EMA | 99407.3 | 99389.28 | 99371.34 |
SMA (simple moving average) of 11scnl26 975154
| SMA period | SMA current | SMA prev | SMA prev2 | | 5 day SMA | 99339.4 | 99481.71 | 99628.02 | | 12 day SMA | 99614.73 | 99586.69 | 99596.78 | | 20 day SMA | 99750.94 | 99749.74 | 99748.94 | | 35 day SMA | 99642.38 | 99618.13 | 99584.17 | | 50 day SMA | 99428.04 | 99414.35 | 99397.77 | | 100 day SMA | | 150 day SMA | | 200 day SMA |
|
|
