736ntpc25d 961906 full analysis,charts,indicators,moving averages,SMA,DMA,EMA,ADX,MACD,RSI736ntpc25d 961906 WideScreen charts, DMA,SMA,EMA technical analysis, forecast prediction, by indicators ADX,MACD,RSI,CCI BSE stock exchange
Daily price and charts and targets 736ntpc25d Strong Daily Stock price targets for 736ntpc25d 961906 are 1065 and 1065 | Daily Target 1 | 1065 | | Daily Target 2 | 1065 | | Daily Target 3 | 1065 | | Daily Target 4 | 1065 | | Daily Target 5 | 1065 |
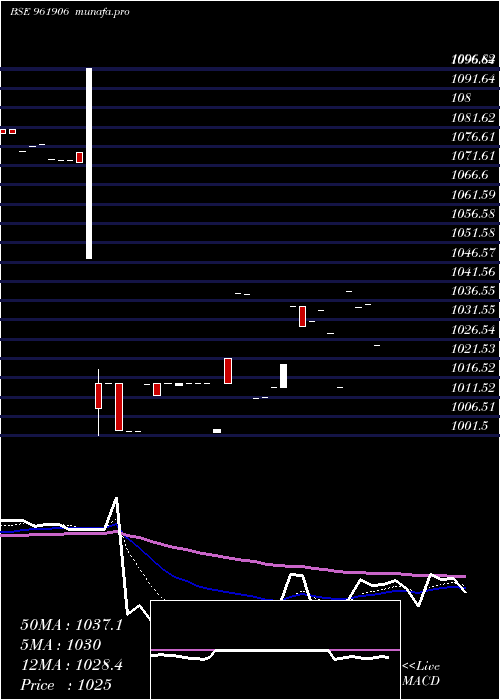
Daily price and volume 736ntpc25d
| Date |
Closing |
Open |
Range |
Volume |
Fri 29 August 2025 |
1065.00 (0.66%) |
1065.00 |
1065.00 - 1065.00 |
2.0408 times |
Wed 30 July 2025 |
1058.00 (0.33%) |
1058.00 |
1058.00 - 1058.00 |
0.5102 times |
Tue 29 July 2025 |
1054.50 (0.14%) |
1054.50 |
1054.50 - 1054.50 |
0.0204 times |
Mon 28 July 2025 |
1053.01 (0.1%) |
1053.01 |
1053.01 - 1053.01 |
0.0204 times |
Mon 21 July 2025 |
1052.00 (0%) |
1052.00 |
1052.00 - 1052.00 |
0.1837 times |
Mon 14 July 2025 |
1052.00 (-1.12%) |
1054.00 |
1052.00 - 1054.00 |
1.3673 times |
Wed 09 July 2025 |
1063.88 (-0.01%) |
1048.35 |
1048.35 - 1063.88 |
2.3469 times |
Mon 07 July 2025 |
1063.99 (1.5%) |
1063.99 |
1063.99 - 1063.99 |
2.0408 times |
Mon 30 June 2025 |
1048.30 (0.59%) |
1048.30 |
1048.30 - 1048.30 |
1.2653 times |
Thu 05 June 2025 |
1042.18 (-0.74%) |
1042.18 |
1042.18 - 1043.00 |
0.2041 times |
Fri 30 May 2025 |
1050.00 (0%) |
1050.00 |
1050.00 - 1050.00 |
0.1633 times |
Weekly price and charts 736ntpc25d Strong weekly Stock price targets for 736ntpc25d 961906 are 1059.01 and 1071 | Weekly Target 1 | 1049.01 | | Weekly Target 2 | 1057.01 | | Weekly Target 3 | 1061.0033333333 | | Weekly Target 4 | 1069 | | Weekly Target 5 | 1072.99 |
Weekly price and volumes for 736ntpc25d
| Date |
Closing |
Open |
Range |
Volume |
Fri 29 August 2025 |
1065.00 (1.24%) |
1053.01 |
1053.01 - 1065.00 |
1.503 times |
Mon 21 July 2025 |
1052.00 (0%) |
1052.00 |
1052.00 - 1052.00 |
0.1065 times |
Mon 14 July 2025 |
1052.00 (-1.12%) |
1054.00 |
1052.00 - 1054.00 |
0.7929 times |
Wed 09 July 2025 |
1063.88 (1.49%) |
1063.99 |
1048.35 - 1063.99 |
2.5444 times |
Mon 30 June 2025 |
1048.30 (0.59%) |
1048.30 |
1048.30 - 1048.30 |
0.7337 times |
Thu 05 June 2025 |
1042.18 (-0.74%) |
1042.18 |
1042.18 - 1043.00 |
0.1183 times |
Fri 30 May 2025 |
1050.00 (1.16%) |
1040.11 |
1040.11 - 1050.00 |
0.8757 times |
Thu 15 May 2025 |
1037.91 (-0.96%) |
1037.44 |
1037.44 - 1037.91 |
1.2899 times |
Fri 02 May 2025 |
1048.00 (0.1%) |
1040.02 |
1040.02 - 1048.00 |
1.9172 times |
Tue 15 April 2025 |
1046.95 (1.41%) |
1040.05 |
1040.05 - 1049.00 |
0.1183 times |
Fri 11 April 2025 |
1032.40 (-0.3%) |
1025.00 |
1025.00 - 1033.15 |
2.7929 times |

Monthly price and charts 736ntpc25d Strong monthly Stock price targets for 736ntpc25d 961906 are 1065 and 1065 | Monthly Target 1 | 1065 | | Monthly Target 2 | 1065 | | Monthly Target 3 | 1065 | | Monthly Target 4 | 1065 | | Monthly Target 5 | 1065 |
Monthly price and volumes 736ntpc25d
| Date |
Closing |
Open |
Range |
Volume |
Fri 29 August 2025 |
1065.00 (0.66%) |
1065.00 |
1065.00 - 1065.00 |
0.4388 times |
Wed 30 July 2025 |
1058.00 (0.93%) |
1063.99 |
1048.35 - 1063.99 |
1.3953 times |
Mon 30 June 2025 |
1048.30 (-0.16%) |
1042.18 |
1042.18 - 1048.30 |
0.3159 times |
Fri 30 May 2025 |
1050.00 (0.48%) |
1048.00 |
1037.44 - 1050.00 |
0.8074 times |
Tue 22 April 2025 |
1045.00 (1.15%) |
1032.40 |
1032.40 - 1049.00 |
0.7547 times |
Wed 26 March 2025 |
1033.15 (0.8%) |
1033.15 |
1033.15 - 1033.15 |
0.6889 times |
Tue 25 February 2025 |
1025.00 (-0.96%) |
1035.49 |
1025.00 - 1035.49 |
0.3466 times |
Wed 29 January 2025 |
1034.89 (1.46%) |
1035.00 |
1014.14 - 1039.00 |
1.7376 times |
Mon 30 December 2024 |
1020.00 (-1.78%) |
1038.28 |
1011.21 - 1038.28 |
0.5441 times |
Thu 28 November 2024 |
1038.48 (2.31%) |
1015.00 |
1002.22 - 1038.48 |
2.9706 times |
Mon 21 October 2024 |
1015.00 (0.02%) |
1014.99 |
1011.99 - 1015.00 |
3.6727 times |

DMA SMA EMA moving averages of 736ntpc25d 961906
DMA (daily moving average) of 736ntpc25d 961906
| DMA period | DMA value | | 5 day DMA | 1056.5 | | 12 day DMA | 1054.41 | | 20 day DMA | 1048.82 | | 35 day DMA | 1039.37 | | 50 day DMA | 1031.36 | | 100 day DMA | 1048.27 | | 150 day DMA | 1056.91 | | 200 day DMA | 1069.28 | EMA (exponential moving average) of 736ntpc25d 961906
| EMA period | EMA current | EMA prev | EMA prev2 | | 5 day EMA | 1058.48 | 1055.22 | 1053.83 | | 12 day EMA | 1053.89 | 1051.87 | 1050.75 | | 20 day EMA | 1049.51 | 1047.88 | 1046.82 | | 35 day EMA | 1043.83 | 1042.58 | 1041.67 | | 50 day EMA | 1037.7 | 1036.59 | 1035.72 |
SMA (simple moving average) of 736ntpc25d 961906
| SMA period | SMA current | SMA prev | SMA prev2 | | 5 day SMA | 1056.5 | 1053.9 | 1055.08 | | 12 day SMA | 1054.41 | 1052.33 | 1050.66 | | 20 day SMA | 1048.82 | 1046.82 | 1045.69 | | 35 day SMA | 1039.37 | 1038.61 | 1037.38 | | 50 day SMA | 1031.36 | 1032 | 1032.29 | | 100 day SMA | 1048.27 | 1048.67 | 1048.95 | | 150 day SMA | 1056.91 | 1056.84 | 1056.74 | | 200 day SMA | 1069.28 | 1069.61 | 1069.96 |
|
|
