920efsl26 938358 full analysis,charts,indicators,moving averages,SMA,DMA,EMA,ADX,MACD,RSI920efsl26 938358 WideScreen charts, DMA,SMA,EMA technical analysis, forecast prediction, by indicators ADX,MACD,RSI,CCI BSE stock exchange
Daily price and charts and targets 920efsl26 Strong Daily Stock price targets for 920efsl26 938358 are 994.5 and 997.51 | Daily Target 1 | 993.99 | | Daily Target 2 | 995 | | Daily Target 3 | 997.00333333333 | | Daily Target 4 | 998.01 | | Daily Target 5 | 1000.01 |
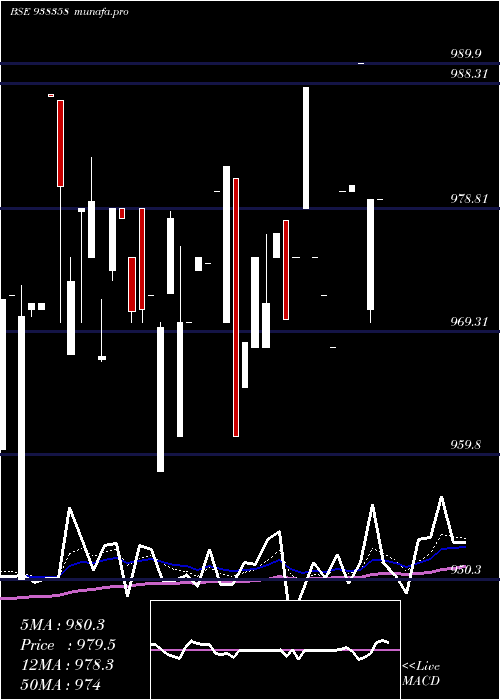
Daily price and volume 920efsl26
| Date |
Closing |
Open |
Range |
Volume |
Mon 24 November 2025 |
996.00 (-0.3%) |
999.01 |
996.00 - 999.01 |
0.1126 times |
Fri 21 November 2025 |
999.01 (0.3%) |
996.00 |
988.00 - 999.01 |
2.5314 times |
Thu 20 November 2025 |
996.00 (0.06%) |
996.00 |
996.00 - 996.00 |
0.1309 times |
Tue 18 November 2025 |
995.41 (-0.46%) |
1000.00 |
995.41 - 1000.00 |
0.4005 times |
Mon 17 November 2025 |
1000.00 (0.7%) |
1000.00 |
1000.00 - 1000.00 |
0.3377 times |
Fri 14 November 2025 |
993.00 (-0.7%) |
1000.00 |
993.00 - 1000.00 |
0.1309 times |
Thu 13 November 2025 |
1000.00 (-0.19%) |
1001.95 |
1000.00 - 1001.95 |
2.8377 times |
Wed 12 November 2025 |
1001.90 (0.19%) |
995.00 |
995.00 - 1001.90 |
0.6073 times |
Tue 11 November 2025 |
1000.00 (-0.09%) |
995.00 |
995.00 - 1000.00 |
2.8848 times |
Mon 10 November 2025 |
1000.95 (0.4%) |
1000.00 |
1000.00 - 1000.95 |
0.0262 times |
Fri 07 November 2025 |
997.00 (-0.2%) |
997.00 |
997.00 - 997.00 |
0.0131 times |
Weekly price and charts 920efsl26 Strong weekly Stock price targets for 920efsl26 938358 are 994.5 and 997.51 | Weekly Target 1 | 993.99 | | Weekly Target 2 | 995 | | Weekly Target 3 | 997.00333333333 | | Weekly Target 4 | 998.01 | | Weekly Target 5 | 1000.01 |
Weekly price and volumes for 920efsl26
| Date |
Closing |
Open |
Range |
Volume |
Mon 24 November 2025 |
996.00 (-0.3%) |
999.01 |
996.00 - 999.01 |
0.0562 times |
Fri 21 November 2025 |
999.01 (0.61%) |
1000.00 |
988.00 - 1000.00 |
1.6978 times |
Fri 14 November 2025 |
993.00 (-0.4%) |
1000.00 |
993.00 - 1001.95 |
3.2388 times |
Fri 07 November 2025 |
997.00 (-0.2%) |
995.30 |
987.05 - 1000.00 |
0.86 times |
Fri 31 October 2025 |
999.00 (0.2%) |
991.95 |
987.38 - 999.00 |
0.4575 times |
Thu 23 October 2025 |
997.00 (0.1%) |
996.00 |
996.00 - 999.00 |
0.5555 times |
Thu 16 October 2025 |
996.00 (0.61%) |
990.00 |
990.00 - 1002.85 |
0.4248 times |
Thu 09 October 2025 |
990.00 (-0.6%) |
995.00 |
990.00 - 995.00 |
0.532 times |
Fri 03 October 2025 |
996.00 (0.61%) |
995.00 |
995.00 - 996.00 |
0.5097 times |
Fri 26 September 2025 |
990.00 (0.39%) |
961.54 |
961.54 - 996.00 |
1.6678 times |
Fri 19 September 2025 |
986.20 (-0.38%) |
990.00 |
986.20 - 990.00 |
0.7267 times |

Monthly price and charts 920efsl26 Strong monthly Stock price targets for 920efsl26 938358 are 991.53 and 1006.43 | Monthly Target 1 | 980.1 | | Monthly Target 2 | 988.05 | | Monthly Target 3 | 995 | | Monthly Target 4 | 1002.95 | | Monthly Target 5 | 1009.9 |
Monthly price and volumes 920efsl26
| Date |
Closing |
Open |
Range |
Volume |
Mon 24 November 2025 |
996.00 (-0.3%) |
995.30 |
987.05 - 1001.95 |
0.5217 times |
Fri 31 October 2025 |
999.00 (0.4%) |
996.00 |
987.38 - 1002.85 |
0.2035 times |
Tue 30 September 2025 |
995.00 (0.1%) |
982.50 |
961.54 - 996.00 |
0.2775 times |
Thu 28 August 2025 |
994.00 (0.12%) |
992.80 |
985.00 - 1000.00 |
7.5575 times |
Tue 29 July 2025 |
992.80 (1.05%) |
982.50 |
980.90 - 1000.00 |
0.3745 times |
Mon 30 June 2025 |
982.50 (0.23%) |
981.18 |
981.00 - 998.00 |
0.1638 times |
Fri 30 May 2025 |
980.20 (-0.99%) |
990.00 |
960.10 - 998.00 |
0.0753 times |
Wed 30 April 2025 |
990.00 (1.02%) |
985.00 |
975.00 - 999.90 |
0.1404 times |
Wed 26 March 2025 |
980.00 (0.51%) |
975.00 |
970.00 - 980.00 |
0.2463 times |
Fri 28 February 2025 |
975.00 (0%) |
968.00 |
920.00 - 989.90 |
0.4395 times |
Fri 31 January 2025 |
975.00 (0.36%) |
987.50 |
958.55 - 987.50 |
0.7484 times |

DMA SMA EMA moving averages of 920efsl26 938358
DMA (daily moving average) of 920efsl26 938358
| DMA period | DMA value | | 5 day DMA | 997.28 | | 12 day DMA | 998.19 | | 20 day DMA | 997.47 | | 35 day DMA | 995.28 | | 50 day DMA | 994.45 | | 100 day DMA | 991.22 | | 150 day DMA | 986.66 | | 200 day DMA | 982.59 | EMA (exponential moving average) of 920efsl26 938358
| EMA period | EMA current | EMA prev | EMA prev2 | | 5 day EMA | 997.09 | 997.63 | 996.94 | | 12 day EMA | 997.31 | 997.55 | 997.28 | | 20 day EMA | 996.92 | 997.02 | 996.81 | | 35 day EMA | 995.94 | 995.94 | 995.76 | | 50 day EMA | 994.65 | 994.6 | 994.42 |
SMA (simple moving average) of 920efsl26 938358
| SMA period | SMA current | SMA prev | SMA prev2 | | 5 day SMA | 997.28 | 996.68 | 996.88 | | 12 day SMA | 998.19 | 998.52 | 997.53 | | 20 day SMA | 997.47 | 997.47 | 997.27 | | 35 day SMA | 995.28 | 995.11 | 994.68 | | 50 day SMA | 994.45 | 994.49 | 994.36 | | 100 day SMA | 991.22 | 991.16 | 990.94 | | 150 day SMA | 986.66 | 986.54 | 986.35 | | 200 day SMA | 982.59 | 982.42 | 982.21 |
|
|
