89efsl25 938206 full analysis,charts,indicators,moving averages,SMA,DMA,EMA,ADX,MACD,RSI89efsl25 938206 WideScreen charts, DMA,SMA,EMA technical analysis, forecast prediction, by indicators ADX,MACD,RSI,CCI BSE stock exchange
Daily price and charts and targets 89efsl25 Strong Daily Stock price targets for 89efsl25 938206 are 984.5 and 991.5 | Daily Target 1 | 983.33 | | Daily Target 2 | 985.67 | | Daily Target 3 | 990.33333333333 | | Daily Target 4 | 992.67 | | Daily Target 5 | 997.33 |
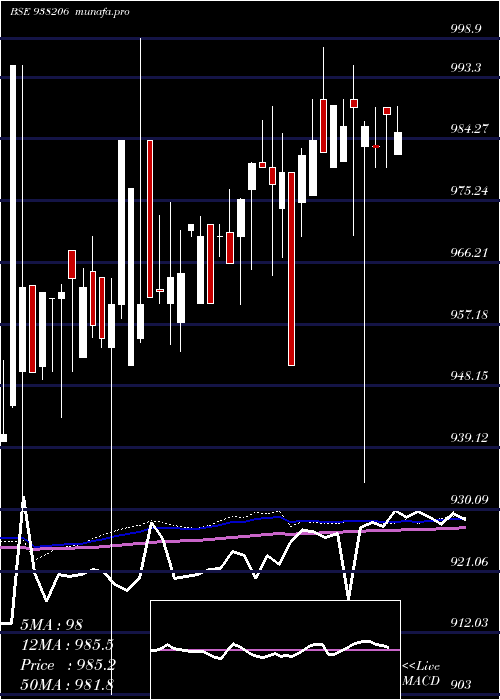
Daily price and volume 89efsl25
| Date |
Closing |
Open |
Range |
Volume |
Fri 30 May 2025 |
988.00 (-1.1%) |
995.00 |
988.00 - 995.00 |
0.7815 times |
Mon 26 May 2025 |
999.00 (0%) |
999.00 |
999.00 - 999.00 |
2.6179 times |
Thu 22 May 2025 |
999.00 (0.41%) |
999.00 |
999.00 - 999.00 |
1.3024 times |
Wed 21 May 2025 |
994.94 (0.5%) |
994.00 |
994.00 - 994.94 |
0.2214 times |
Tue 20 May 2025 |
990.01 (-0.71%) |
990.01 |
990.01 - 990.01 |
0.0521 times |
Fri 16 May 2025 |
997.04 (0.3%) |
991.30 |
991.30 - 997.65 |
0.2891 times |
Thu 15 May 2025 |
994.10 (0.31%) |
995.00 |
992.50 - 995.00 |
3.9463 times |
Tue 13 May 2025 |
991.00 (-0.95%) |
991.00 |
991.00 - 991.00 |
0.0026 times |
Mon 12 May 2025 |
1000.55 (0.46%) |
982.20 |
982.20 - 1000.55 |
0.0052 times |
Thu 08 May 2025 |
996.00 (0%) |
996.00 |
996.00 - 996.00 |
0.7815 times |
Wed 07 May 2025 |
996.00 (0.1%) |
995.01 |
995.00 - 996.00 |
0.0365 times |

Weekly price and charts 89efsl25 Strong weekly Stock price targets for 89efsl25 938206 are 982.5 and 993.5 | Weekly Target 1 | 980.67 | | Weekly Target 2 | 984.33 | | Weekly Target 3 | 991.66666666667 | | Weekly Target 4 | 995.33 | | Weekly Target 5 | 1002.67 |
Weekly price and volumes for 89efsl25
| Date |
Closing |
Open |
Range |
Volume |
Fri 30 May 2025 |
988.00 (-1.1%) |
999.00 |
988.00 - 999.00 |
0.6006 times |
Thu 22 May 2025 |
999.00 (0.2%) |
990.01 |
990.01 - 999.00 |
0.2784 times |
Fri 16 May 2025 |
997.04 (0.1%) |
982.20 |
982.20 - 1000.55 |
0.7497 times |
Thu 08 May 2025 |
996.00 (0.1%) |
995.00 |
995.00 - 996.00 |
0.202 times |
Fri 02 May 2025 |
995.00 (0.53%) |
989.80 |
989.79 - 995.00 |
0.4151 times |
Fri 25 April 2025 |
989.80 (0.39%) |
986.00 |
984.90 - 989.80 |
1.0193 times |
Thu 17 April 2025 |
986.00 (-0.48%) |
981.51 |
980.20 - 986.00 |
0.1574 times |
Fri 11 April 2025 |
990.80 (0.57%) |
989.80 |
982.00 - 991.80 |
0.4059 times |
Fri 04 April 2025 |
985.22 (-0.26%) |
982.01 |
982.01 - 989.00 |
1.7598 times |
Wed 26 March 2025 |
987.79 (0.47%) |
988.80 |
980.00 - 988.80 |
4.4119 times |
Fri 21 March 2025 |
983.20 (-0.28%) |
983.21 |
980.00 - 988.80 |
2.1588 times |
Monthly price and charts 89efsl25 Strong monthly Stock price targets for 89efsl25 938206 are 975.93 and 994.28 | Monthly Target 1 | 971.9 | | Monthly Target 2 | 979.95 | | Monthly Target 3 | 990.25 | | Monthly Target 4 | 998.3 | | Monthly Target 5 | 1008.6 |
Monthly price and volumes 89efsl25
| Date |
Closing |
Open |
Range |
Volume |
Fri 30 May 2025 |
988.00 (-0.28%) |
995.00 |
982.20 - 1000.55 |
0.4425 times |
Tue 29 April 2025 |
990.80 (0.3%) |
982.01 |
980.20 - 991.80 |
0.8563 times |
Wed 26 March 2025 |
987.79 (0.18%) |
990.00 |
934.00 - 995.00 |
2.1226 times |
Fri 28 February 2025 |
986.00 (0.43%) |
976.00 |
976.00 - 997.65 |
0.6153 times |
Fri 31 January 2025 |
981.80 (-0.1%) |
983.00 |
951.10 - 989.00 |
1.3846 times |
Tue 31 December 2024 |
982.80 (1.13%) |
970.00 |
960.00 - 982.80 |
3.4593 times |
Thu 28 November 2024 |
971.80 (0%) |
960.20 |
960.20 - 972.80 |
0.1107 times |
Thu 31 October 2024 |
971.80 (1.23%) |
984.02 |
953.20 - 984.02 |
0.508 times |
Thu 19 September 2024 |
960.01 (0%) |
960.00 |
951.20 - 998.90 |
0.2014 times |
Thu 29 August 2024 |
960.00 (1.03%) |
963.80 |
903.00 - 970.00 |
0.2993 times |
Wed 31 July 2024 |
950.20 (-1.28%) |
962.80 |
943.51 - 968.00 |
0.2684 times |

DMA SMA EMA moving averages of 89efsl25 938206
DMA (daily moving average) of 89efsl25 938206
| DMA period | DMA value | | 5 day DMA | 994.19 | | 12 day DMA | 995.05 | | 20 day DMA | 992.17 | | 35 day DMA | 989.51 | | 50 day DMA | 988.01 | | 100 day DMA | 981.69 | | 150 day DMA | 975.56 | | 200 day DMA | 970.78 | EMA (exponential moving average) of 89efsl25 938206
| EMA period | EMA current | EMA prev | EMA prev2 | | 5 day EMA | 993.85 | 996.78 | 995.67 | | 12 day EMA | 993.82 | 994.88 | 994.13 | | 20 day EMA | 992.64 | 993.13 | 992.51 | | 35 day EMA | 990.61 | 990.76 | 990.27 | | 50 day EMA | 988.37 | 988.39 | 987.96 |
SMA (simple moving average) of 89efsl25 938206
| SMA period | SMA current | SMA prev | SMA prev2 | | 5 day SMA | 994.19 | 996 | 995.02 | | 12 day SMA | 995.05 | 995.64 | 994.95 | | 20 day SMA | 992.17 | 992.31 | 991.81 | | 35 day SMA | 989.51 | 989.37 | 988.92 | | 50 day SMA | 988.01 | 988.05 | 987.75 | | 100 day SMA | 981.69 | 981.53 | 981.25 | | 150 day SMA | 975.56 | 975.3 | 975.05 | | 200 day SMA | 970.78 | 970.59 | 970.35 |
|
|
