916efsl26 937495 full analysis,charts,indicators,moving averages,SMA,DMA,EMA,ADX,MACD,RSI916efsl26 937495 WideScreen charts, DMA,SMA,EMA technical analysis, forecast prediction, by indicators ADX,MACD,RSI,CCI BSE stock exchange
Daily price and charts and targets 916efsl26 Strong Daily Stock price targets for 916efsl26 937495 are 991.58 and 997.22 | Daily Target 1 | 987.3 | | Daily Target 2 | 990.22 | | Daily Target 3 | 992.93666666667 | | Daily Target 4 | 995.86 | | Daily Target 5 | 998.58 |
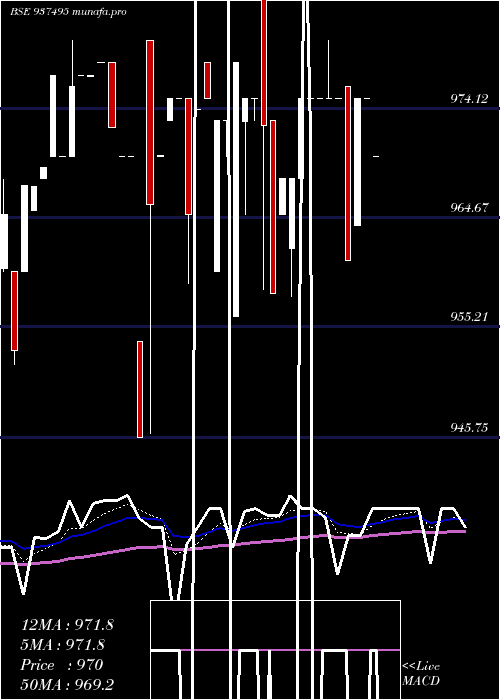
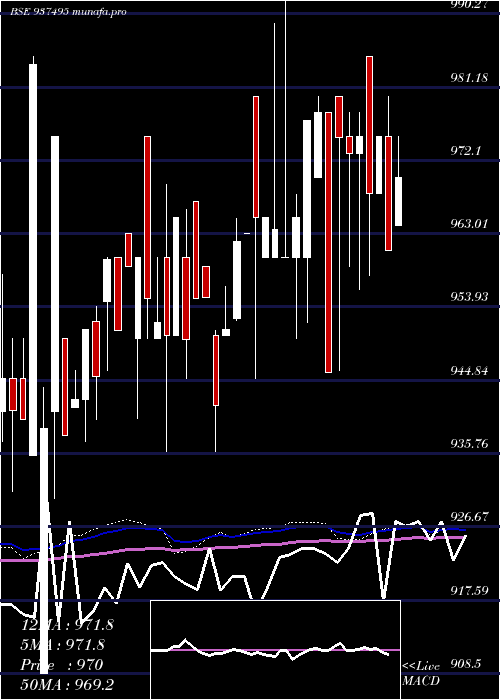
Daily price and volume 916efsl26
| Date |
Closing |
Open |
Range |
Volume |
Fri 21 November 2025 |
993.15 (-0.24%) |
990.01 |
990.01 - 995.65 |
1.8421 times |
Thu 20 November 2025 |
995.50 (-0.45%) |
989.20 |
989.20 - 995.50 |
1.482 times |
Thu 13 November 2025 |
1000.00 (0%) |
1000.01 |
1000.00 - 1000.01 |
0.2493 times |
Wed 12 November 2025 |
1000.00 (0.6%) |
996.00 |
996.00 - 1002.00 |
0.5429 times |
Tue 11 November 2025 |
994.00 (0%) |
994.00 |
994.00 - 994.00 |
0.277 times |
Mon 10 November 2025 |
994.00 (-0.3%) |
991.26 |
991.26 - 998.00 |
0.3601 times |
Fri 07 November 2025 |
997.00 (0.2%) |
997.00 |
997.00 - 997.00 |
0.1053 times |
Thu 06 November 2025 |
995.00 (0%) |
995.00 |
995.00 - 995.00 |
0.1385 times |
Tue 04 November 2025 |
995.00 (0%) |
995.00 |
994.00 - 995.01 |
4.6981 times |
Mon 03 November 2025 |
995.00 (0.01%) |
995.00 |
995.00 - 995.00 |
0.3047 times |
Fri 31 October 2025 |
994.90 (0.49%) |
990.00 |
990.00 - 994.90 |
0.1468 times |
Weekly price and charts 916efsl26 Strong weekly Stock price targets for 916efsl26 937495 are 991.18 and 997.63 | Weekly Target 1 | 986.22 | | Weekly Target 2 | 989.68 | | Weekly Target 3 | 992.66666666667 | | Weekly Target 4 | 996.13 | | Weekly Target 5 | 999.12 |
Weekly price and volumes for 916efsl26
| Date |
Closing |
Open |
Range |
Volume |
Fri 21 November 2025 |
993.15 (-0.69%) |
989.20 |
989.20 - 995.65 |
0.9066 times |
Thu 13 November 2025 |
1000.00 (0.3%) |
991.26 |
991.26 - 1002.00 |
0.3898 times |
Fri 07 November 2025 |
997.00 (0.21%) |
995.00 |
994.00 - 997.00 |
1.4309 times |
Fri 31 October 2025 |
994.90 (0.7%) |
988.00 |
988.00 - 994.90 |
0.6452 times |
Mon 20 October 2025 |
988.00 (-0.2%) |
990.00 |
988.00 - 990.00 |
0.0385 times |
Thu 16 October 2025 |
990.00 (-0.5%) |
986.20 |
981.00 - 990.00 |
0.3846 times |
Fri 10 October 2025 |
995.00 (0.49%) |
990.20 |
990.00 - 995.00 |
4.2211 times |
Fri 03 October 2025 |
990.10 (0.52%) |
983.05 |
983.05 - 995.00 |
1.3667 times |
Thu 25 September 2025 |
985.00 (-0.3%) |
990.00 |
984.15 - 991.00 |
0.2236 times |
Fri 19 September 2025 |
988.00 (0.61%) |
990.00 |
983.16 - 990.00 |
0.3929 times |
Fri 12 September 2025 |
981.99 (-0.81%) |
990.00 |
981.99 - 994.00 |
2.2167 times |
Monthly price and charts 916efsl26 Strong monthly Stock price targets for 916efsl26 937495 are 984.78 and 997.58 | Monthly Target 1 | 981.98 | | Monthly Target 2 | 987.57 | | Monthly Target 3 | 994.78333333333 | | Monthly Target 4 | 1000.37 | | Monthly Target 5 | 1007.58 |
Monthly price and volumes 916efsl26
| Date |
Closing |
Open |
Range |
Volume |
Fri 21 November 2025 |
993.15 (-0.18%) |
995.00 |
989.20 - 1002.00 |
0.7581 times |
Fri 31 October 2025 |
994.90 (0.32%) |
992.00 |
981.00 - 995.00 |
1.4964 times |
Tue 30 September 2025 |
991.75 (0.08%) |
989.00 |
981.99 - 995.00 |
1.2601 times |
Fri 29 August 2025 |
990.99 (-0.1%) |
988.00 |
976.20 - 994.95 |
0.7106 times |
Thu 31 July 2025 |
992.00 (0.43%) |
978.20 |
978.20 - 999.99 |
0.7142 times |
Mon 30 June 2025 |
987.80 (0.28%) |
985.00 |
976.20 - 990.00 |
1.0046 times |
Fri 30 May 2025 |
985.00 (1.55%) |
972.02 |
970.80 - 989.80 |
1.0879 times |
Wed 30 April 2025 |
970.00 (0.94%) |
964.00 |
960.60 - 990.00 |
0.8425 times |
Fri 28 March 2025 |
961.00 (-1.23%) |
973.00 |
956.12 - 985.00 |
0.5485 times |
Fri 28 February 2025 |
973.00 (-0.41%) |
970.00 |
945.75 - 980.00 |
1.5772 times |
Fri 31 January 2025 |
977.00 (1.77%) |
962.01 |
950.00 - 999.99 |
2.6981 times |
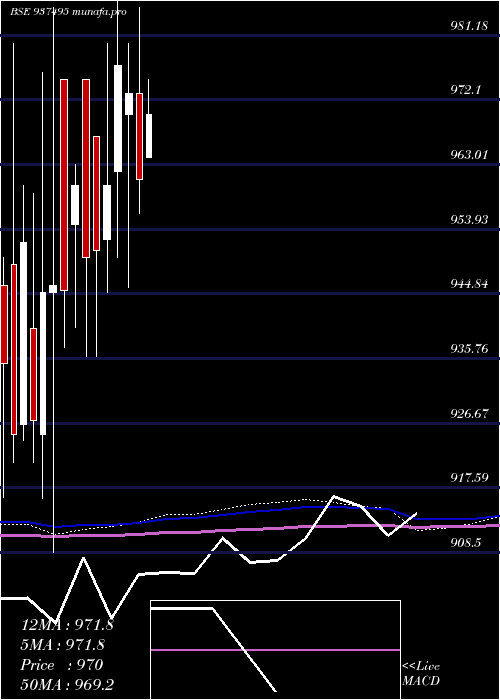
DMA SMA EMA moving averages of 916efsl26 937495
DMA (daily moving average) of 916efsl26 937495
| DMA period | DMA value | | 5 day DMA | 996.53 | | 12 day DMA | 995.3 | | 20 day DMA | 993.48 | | 35 day DMA | 991.57 | | 50 day DMA | 990.11 | | 100 day DMA | 987.96 | | 150 day DMA | 983.38 | | 200 day DMA | 977.88 | EMA (exponential moving average) of 916efsl26 937495
| EMA period | EMA current | EMA prev | EMA prev2 | | 5 day EMA | 995.63 | 996.87 | 997.55 | | 12 day EMA | 995.05 | 995.39 | 995.37 | | 20 day EMA | 993.95 | 994.03 | 993.87 | | 35 day EMA | 992.04 | 991.97 | 991.76 | | 50 day EMA | 990.29 | 990.17 | 989.95 |
SMA (simple moving average) of 916efsl26 937495
| SMA period | SMA current | SMA prev | SMA prev2 | | 5 day SMA | 996.53 | 996.7 | 997 | | 12 day SMA | 995.3 | 995.28 | 994.83 | | 20 day SMA | 993.48 | 993.47 | 993.34 | | 35 day SMA | 991.57 | 991.35 | 990.97 | | 50 day SMA | 990.11 | 989.97 | 989.68 | | 100 day SMA | 987.96 | 987.88 | 987.72 | | 150 day SMA | 983.38 | 983.26 | 983.09 | | 200 day SMA | 977.88 | 977.69 | 977.48 |
|
|
