0efsl26 937343 full analysis,charts,indicators,moving averages,SMA,DMA,EMA,ADX,MACD,RSI0efsl26 937343 WideScreen charts, DMA,SMA,EMA technical analysis, forecast prediction, by indicators ADX,MACD,RSI,CCI BSE stock exchange
Daily price and charts and targets 0efsl26 Strong Daily Stock price targets for 0efsl26 937343 are 1554.7 and 1564.2 | Daily Target 1 | 1546.8 | | Daily Target 2 | 1553.1 | | Daily Target 3 | 1556.3 | | Daily Target 4 | 1562.6 | | Daily Target 5 | 1565.8 |
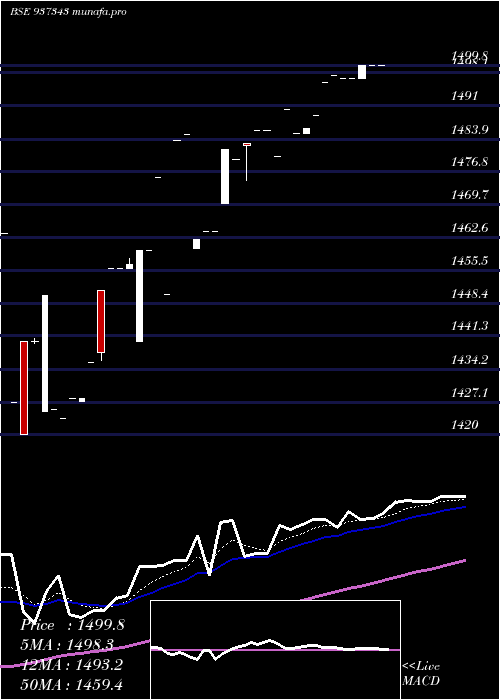
Daily price and volume 0efsl26
| Date |
Closing |
Open |
Range |
Volume |
Thu 13 November 2025 |
1559.40 (0.15%) |
1550.00 |
1550.00 - 1559.50 |
0.529 times |
Wed 12 November 2025 |
1557.00 (0.45%) |
1560.00 |
1552.00 - 1560.00 |
2.5835 times |
Tue 11 November 2025 |
1550.00 (0%) |
1563.80 |
1550.00 - 1563.80 |
2.4777 times |
Mon 10 November 2025 |
1550.00 (-0.64%) |
1550.00 |
1550.00 - 1550.00 |
3.3408 times |
Fri 07 November 2025 |
1560.00 (-0.64%) |
1560.00 |
1560.00 - 1560.00 |
0.2895 times |
Thu 06 November 2025 |
1570.00 (0.39%) |
1570.00 |
1570.00 - 1570.00 |
0.0278 times |
Tue 04 November 2025 |
1563.96 (0.06%) |
1563.96 |
1563.96 - 1563.96 |
0.0195 times |
Mon 03 November 2025 |
1562.95 (1.16%) |
1545.00 |
1545.00 - 1562.95 |
0.2394 times |
Thu 30 October 2025 |
1545.00 (0.64%) |
1553.00 |
1545.00 - 1560.00 |
0.4649 times |
Wed 29 October 2025 |
1535.20 (-0.31%) |
1535.20 |
1535.20 - 1535.20 |
0.0278 times |
Tue 28 October 2025 |
1540.00 (0.64%) |
1540.00 |
1540.00 - 1540.00 |
0.0362 times |
Weekly price and charts 0efsl26 Strong weekly Stock price targets for 0efsl26 937343 are 1554.7 and 1568.5 | Weekly Target 1 | 1543.93 | | Weekly Target 2 | 1551.67 | | Weekly Target 3 | 1557.7333333333 | | Weekly Target 4 | 1565.47 | | Weekly Target 5 | 1571.53 |
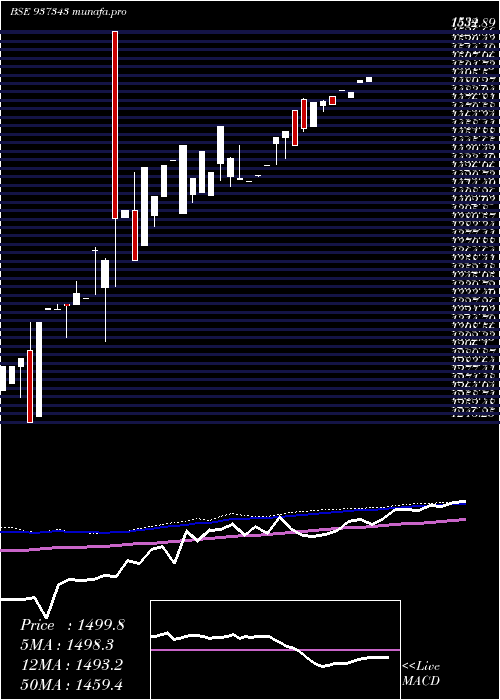
Weekly price and volumes for 0efsl26
| Date |
Closing |
Open |
Range |
Volume |
Thu 13 November 2025 |
1559.40 (-0.04%) |
1550.00 |
1550.00 - 1563.80 |
6.1692 times |
Fri 07 November 2025 |
1560.00 (0.97%) |
1545.00 |
1545.00 - 1570.00 |
0.3981 times |
Thu 30 October 2025 |
1545.00 (-0.34%) |
1530.20 |
1530.20 - 1560.00 |
0.375 times |
Thu 23 October 2025 |
1550.25 (0.06%) |
1549.75 |
1528.20 - 1550.25 |
1.0288 times |
Thu 16 October 2025 |
1549.25 (0.14%) |
1549.24 |
1524.17 - 1549.25 |
0.0423 times |
Fri 10 October 2025 |
1547.08 (0.39%) |
1541.00 |
1539.41 - 1547.15 |
0.2769 times |
Fri 03 October 2025 |
1541.00 (0.2%) |
1539.16 |
1539.16 - 1541.00 |
0.2058 times |
Thu 25 September 2025 |
1538.00 (0.38%) |
1530.00 |
1530.00 - 1538.00 |
1.0635 times |
Thu 18 September 2025 |
1532.20 (-0.33%) |
1510.20 |
1496.04 - 1534.40 |
0.275 times |
Thu 11 September 2025 |
1537.21 (0.8%) |
1520.00 |
1520.00 - 1537.21 |
0.1654 times |
Wed 03 September 2025 |
1525.00 (0.33%) |
1520.00 |
1520.00 - 1525.00 |
0.1731 times |
Monthly price and charts 0efsl26 Strong monthly Stock price targets for 0efsl26 937343 are 1552.2 and 1577.2 | Monthly Target 1 | 1533.13 | | Monthly Target 2 | 1546.27 | | Monthly Target 3 | 1558.1333333333 | | Monthly Target 4 | 1571.27 | | Monthly Target 5 | 1583.13 |
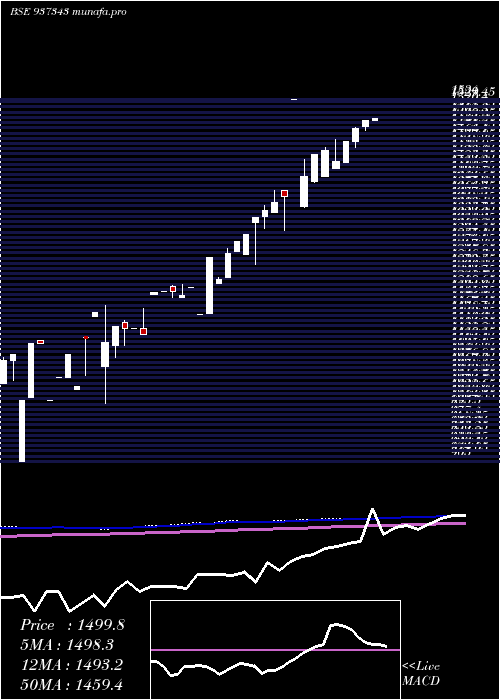
Monthly price and volumes 0efsl26
| Date |
Closing |
Open |
Range |
Volume |
Thu 13 November 2025 |
1559.40 (0.93%) |
1545.00 |
1545.00 - 1570.00 |
2.1376 times |
Thu 30 October 2025 |
1545.00 (0.38%) |
1541.00 |
1524.17 - 1560.00 |
0.6003 times |
Tue 30 September 2025 |
1539.16 (1.26%) |
1520.00 |
1496.04 - 1539.16 |
0.5734 times |
Thu 28 August 2025 |
1520.00 (0.84%) |
1510.00 |
1502.50 - 1520.00 |
0.2122 times |
Thu 31 July 2025 |
1507.40 (0.7%) |
1496.99 |
1496.20 - 1784.00 |
1.4716 times |
Mon 30 June 2025 |
1496.99 (0.99%) |
1485.70 |
1480.20 - 1497.50 |
0.3405 times |
Fri 30 May 2025 |
1482.31 (1.54%) |
1459.80 |
1450.21 - 1484.85 |
0.9527 times |
Wed 30 April 2025 |
1459.80 (2.41%) |
1423.55 |
1423.55 - 1459.80 |
0.3449 times |
Fri 28 March 2025 |
1425.40 (-1.39%) |
1412.99 |
1412.99 - 1463.58 |
1.0572 times |
Fri 21 February 2025 |
1445.55 (0.49%) |
1400.20 |
1400.00 - 1449.96 |
2.3097 times |
Tue 21 January 2025 |
1438.55 (2.75%) |
1391.00 |
1390.00 - 1438.55 |
0.85 times |
DMA SMA EMA moving averages of 0efsl26 937343
DMA (daily moving average) of 0efsl26 937343
| DMA period | DMA value | | 5 day DMA | 1555.28 | | 12 day DMA | 1551.98 | | 20 day DMA | 1548.45 | | 35 day DMA | 1540.12 | | 50 day DMA | 1531.45 | | 100 day DMA | 1494.59 | | 150 day DMA | 1455.05 | | 200 day DMA | 1389.46 | EMA (exponential moving average) of 0efsl26 937343
| EMA period | EMA current | EMA prev | EMA prev2 | | 5 day EMA | 1556.51 | 1555.06 | 1554.09 | | 12 day EMA | 1553.11 | 1551.97 | 1551.05 | | 20 day EMA | 1548.6 | 1547.46 | 1546.46 | | 35 day EMA | 1539.85 | 1538.7 | 1537.62 | | 50 day EMA | 1531.09 | 1529.94 | 1528.84 |
SMA (simple moving average) of 0efsl26 937343
| SMA period | SMA current | SMA prev | SMA prev2 | | 5 day SMA | 1555.28 | 1557.4 | 1558.79 | | 12 day SMA | 1551.98 | 1551.21 | 1548.86 | | 20 day SMA | 1548.45 | 1547.53 | 1546.73 | | 35 day SMA | 1540.12 | 1539 | 1537.94 | | 50 day SMA | 1531.45 | 1530.26 | 1529.11 | | 100 day SMA | 1494.59 | 1493.17 | 1491.68 | | 150 day SMA | 1455.05 | 1453.31 | 1451.55 | | 200 day SMA | 1389.46 | 1387.27 | 1385.08 |
|
|
