939efsl26 937339 full analysis,charts,indicators,moving averages,SMA,DMA,EMA,ADX,MACD,RSI939efsl26 937339 WideScreen charts, DMA,SMA,EMA technical analysis, forecast prediction, by indicators ADX,MACD,RSI,CCI BSE stock exchange
Daily price and charts and targets 939efsl26 Strong Daily Stock price targets for 939efsl26 937339 are 1004.5 and 1004.5 | Daily Target 1 | 1004.5 | | Daily Target 2 | 1004.5 | | Daily Target 3 | 1004.5 | | Daily Target 4 | 1004.5 | | Daily Target 5 | 1004.5 |
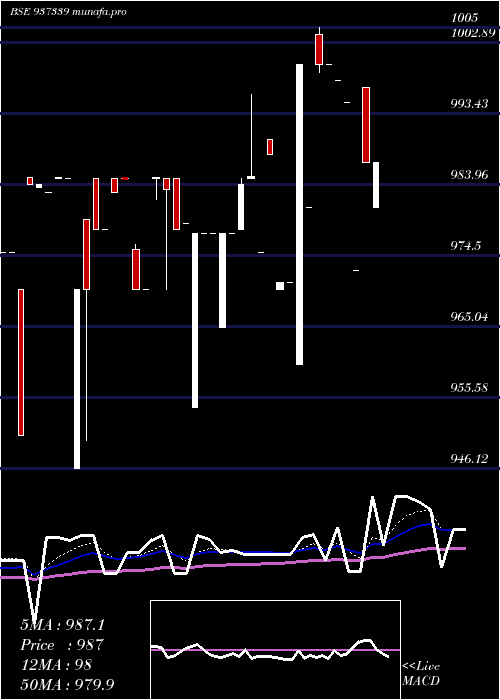
Daily price and volume 939efsl26
| Date |
Closing |
Open |
Range |
Volume |
Wed 17 December 2025 |
1004.50 (-0.15%) |
1004.50 |
1004.50 - 1004.50 |
0.0312 times |
Tue 16 December 2025 |
1006.00 (0.68%) |
1001.92 |
999.50 - 1006.00 |
0.1937 times |
Mon 15 December 2025 |
999.20 (0%) |
999.20 |
999.20 - 999.20 |
0.3436 times |
Tue 09 December 2025 |
999.20 (0.83%) |
999.20 |
999.20 - 999.20 |
1.1903 times |
Mon 08 December 2025 |
991.00 (-0.72%) |
991.21 |
990.20 - 1001.55 |
4.2768 times |
Fri 05 December 2025 |
998.20 (0.78%) |
998.80 |
998.20 - 998.80 |
0.5936 times |
Thu 04 December 2025 |
990.50 (-0.85%) |
999.00 |
990.50 - 999.00 |
1.562 times |
Wed 03 December 2025 |
999.00 (0%) |
999.00 |
999.00 - 999.00 |
0.2281 times |
Tue 02 December 2025 |
999.00 (0.25%) |
999.00 |
997.00 - 999.00 |
0.8966 times |
Thu 27 November 2025 |
996.46 (-0.08%) |
999.99 |
996.13 - 999.99 |
0.6842 times |
Tue 25 November 2025 |
997.25 (0.83%) |
997.25 |
997.25 - 997.25 |
0.6248 times |
Weekly price and charts 939efsl26 Strong weekly Stock price targets for 939efsl26 937339 are 1001.85 and 1008.65 | Weekly Target 1 | 996.43 | | Weekly Target 2 | 1000.47 | | Weekly Target 3 | 1003.2333333333 | | Weekly Target 4 | 1007.27 | | Weekly Target 5 | 1010.03 |
Weekly price and volumes for 939efsl26
| Date |
Closing |
Open |
Range |
Volume |
Wed 17 December 2025 |
1004.50 (0.53%) |
999.20 |
999.20 - 1006.00 |
0.186 times |
Tue 09 December 2025 |
999.20 (0.1%) |
991.21 |
990.20 - 1001.55 |
1.7881 times |
Fri 05 December 2025 |
998.20 (0.17%) |
999.00 |
990.50 - 999.00 |
1.0729 times |
Thu 27 November 2025 |
996.46 (-0.15%) |
989.00 |
989.00 - 999.99 |
0.7377 times |
Fri 21 November 2025 |
998.00 (0.1%) |
1000.00 |
998.00 - 1001.55 |
2.6709 times |
Fri 14 November 2025 |
997.01 (0%) |
997.00 |
994.00 - 1015.00 |
0.61 times |
Thu 06 November 2025 |
997.00 (-0.22%) |
995.00 |
995.00 - 1002.00 |
0.6447 times |
Fri 31 October 2025 |
999.20 (-0.4%) |
987.05 |
987.05 - 999.20 |
0.6764 times |
Mon 20 October 2025 |
1003.22 (0.37%) |
1003.25 |
1003.15 - 1003.25 |
0.3454 times |
Fri 17 October 2025 |
999.55 (0.06%) |
1003.55 |
995.00 - 1003.55 |
1.268 times |
Wed 08 October 2025 |
999.00 (-0.1%) |
1003.55 |
999.00 - 1003.55 |
0.2258 times |

Monthly price and charts 939efsl26 Strong monthly Stock price targets for 939efsl26 937339 are 997.35 and 1013.15 | Monthly Target 1 | 984.43 | | Monthly Target 2 | 994.47 | | Monthly Target 3 | 1000.2333333333 | | Monthly Target 4 | 1010.27 | | Monthly Target 5 | 1016.03 |
Monthly price and volumes 939efsl26
| Date |
Closing |
Open |
Range |
Volume |
Wed 17 December 2025 |
1004.50 (0.81%) |
999.00 |
990.20 - 1006.00 |
0.9042 times |
Thu 27 November 2025 |
996.46 (-0.27%) |
995.00 |
989.00 - 1015.00 |
1.384 times |
Fri 31 October 2025 |
999.20 (0.62%) |
1003.55 |
987.05 - 1003.55 |
0.7829 times |
Tue 30 September 2025 |
993.00 (0.8%) |
1000.00 |
985.91 - 1001.00 |
0.2399 times |
Fri 29 August 2025 |
985.10 (-1.49%) |
983.05 |
983.05 - 1060.00 |
0.3014 times |
Thu 31 July 2025 |
1000.00 (1.52%) |
990.00 |
982.05 - 1000.00 |
1.1229 times |
Mon 30 June 2025 |
985.00 (-1.5%) |
976.50 |
976.50 - 999.55 |
1.1899 times |
Fri 30 May 2025 |
1000.00 (1.48%) |
980.00 |
972.00 - 1005.00 |
1.7448 times |
Wed 30 April 2025 |
985.46 (2.06%) |
966.00 |
965.45 - 995.65 |
1.0571 times |
Fri 28 March 2025 |
965.57 (-3.44%) |
970.00 |
965.25 - 995.00 |
1.273 times |
Fri 28 February 2025 |
1000.00 (1.94%) |
1004.00 |
950.00 - 1005.00 |
0.6959 times |

DMA SMA EMA moving averages of 939efsl26 937339
DMA (daily moving average) of 939efsl26 937339
| DMA period | DMA value | | 5 day DMA | 999.98 | | 12 day DMA | 997.44 | | 20 day DMA | 998.46 | | 35 day DMA | 997.86 | | 50 day DMA | 996.9 | | 100 day DMA | 993.96 | | 150 day DMA | 990.15 | | 200 day DMA | 984.93 | EMA (exponential moving average) of 939efsl26 937339
| EMA period | EMA current | EMA prev | EMA prev2 | | 5 day EMA | 1001.56 | 1000.09 | 997.13 | | 12 day EMA | 999.19 | 998.23 | 996.82 | | 20 day EMA | 998.4 | 997.76 | 996.89 | | 35 day EMA | 997.56 | 997.15 | 996.63 | | 50 day EMA | 996.98 | 996.67 | 996.29 |
SMA (simple moving average) of 939efsl26 937339
| SMA period | SMA current | SMA prev | SMA prev2 | | 5 day SMA | 999.98 | 998.72 | 995.62 | | 12 day SMA | 997.44 | 996.9 | 996.4 | | 20 day SMA | 998.46 | 998.34 | 998 | | 35 day SMA | 997.86 | 997.54 | 997.13 | | 50 day SMA | 996.9 | 996.81 | 996.59 | | 100 day SMA | 993.96 | 993.81 | 993.4 | | 150 day SMA | 990.15 | 989.92 | 989.78 | | 200 day SMA | 984.93 | 984.75 | 984.58 |
|
|
