0ifl25 936826 full analysis,charts,indicators,moving averages,SMA,DMA,EMA,ADX,MACD,RSI0ifl25 936826 WideScreen charts, DMA,SMA,EMA technical analysis, forecast prediction, by indicators ADX,MACD,RSI,CCI BSE stock exchange
Daily price and charts and targets 0ifl25 Strong Daily Stock price targets for 0ifl25 936826 are 1736.54 and 1746.12 | Daily Target 1 | 1728.56 | | Daily Target 2 | 1734.94 | | Daily Target 3 | 1738.1366666667 | | Daily Target 4 | 1744.52 | | Daily Target 5 | 1747.72 |
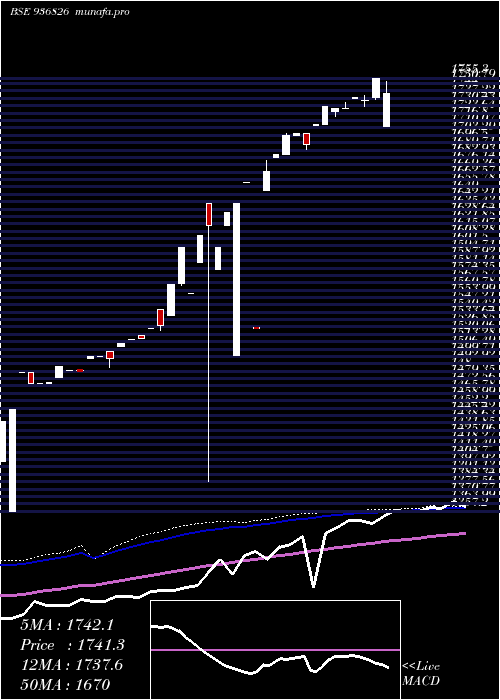
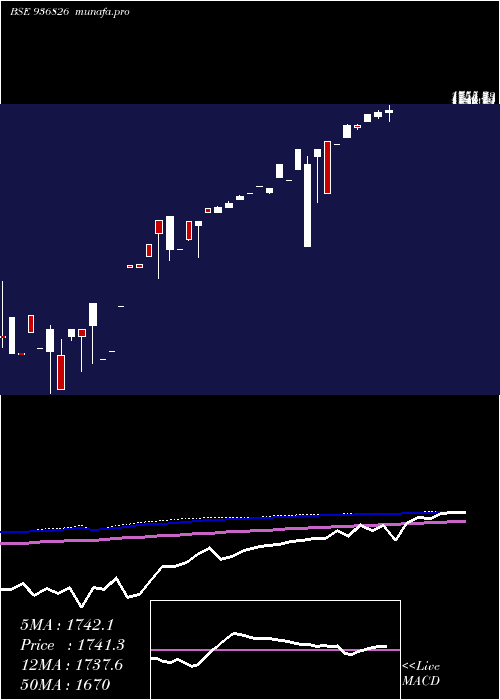
Daily price and volume 0ifl25
| Date |
Closing |
Open |
Range |
Volume |
Fri 16 May 2025 |
1741.33 (0.41%) |
1738.95 |
1731.75 - 1741.33 |
0.7907 times |
Thu 15 May 2025 |
1734.19 (-1.08%) |
1748.00 |
1734.19 - 1748.00 |
0.3859 times |
Mon 12 May 2025 |
1753.09 (-0.13%) |
1711.42 |
1711.42 - 1753.09 |
0.0126 times |
Wed 07 May 2025 |
1755.30 (0.88%) |
1755.30 |
1755.30 - 1755.30 |
0.0157 times |
Tue 06 May 2025 |
1740.00 (0.06%) |
1739.00 |
1738.00 - 1740.00 |
3.4045 times |
Mon 05 May 2025 |
1739.00 (0.19%) |
1737.98 |
1736.10 - 1739.00 |
2.4945 times |
Fri 02 May 2025 |
1735.70 (-0.03%) |
1735.70 |
1735.70 - 1735.70 |
0.1569 times |
Wed 30 April 2025 |
1736.20 (0.05%) |
1735.70 |
1735.70 - 1739.78 |
0.5617 times |
Tue 29 April 2025 |
1735.38 (0.04%) |
1739.78 |
1735.00 - 1739.78 |
0.16 times |
Mon 28 April 2025 |
1734.66 (-0.19%) |
1735.00 |
1729.46 - 1737.00 |
2.0176 times |
Thu 24 April 2025 |
1737.88 (0.56%) |
1737.39 |
1737.39 - 1737.88 |
0.4612 times |

Weekly price and charts 0ifl25 Strong weekly Stock price targets for 0ifl25 936826 are 1726.38 and 1768.05 | Weekly Target 1 | 1693.61 | | Weekly Target 2 | 1717.47 | | Weekly Target 3 | 1735.28 | | Weekly Target 4 | 1759.14 | | Weekly Target 5 | 1776.95 |
Weekly price and volumes for 0ifl25
| Date |
Closing |
Open |
Range |
Volume |
Fri 16 May 2025 |
1741.33 (-0.8%) |
1711.42 |
1711.42 - 1753.09 |
0.805 times |
Wed 07 May 2025 |
1755.30 (1.13%) |
1737.98 |
1736.10 - 1755.30 |
4.0038 times |
Fri 02 May 2025 |
1735.70 (-0.13%) |
1735.00 |
1729.46 - 1739.78 |
1.9605 times |
Thu 24 April 2025 |
1737.88 (0.56%) |
1737.39 |
1737.39 - 1737.88 |
0.3122 times |
Fri 11 April 2025 |
1728.17 (0.04%) |
1727.55 |
1727.55 - 1732.98 |
0.1551 times |
Fri 04 April 2025 |
1727.55 (-0.14%) |
1725.18 |
1720.25 - 1727.55 |
1.2766 times |
Wed 26 March 2025 |
1729.95 (0.96%) |
1713.60 |
1713.60 - 1729.95 |
0.2379 times |
Wed 05 March 2025 |
1713.50 (1.08%) |
1712.49 |
1712.49 - 1713.50 |
0.3696 times |
Fri 21 February 2025 |
1695.20 (-0.57%) |
1704.85 |
1690.20 - 1704.85 |
0.4099 times |
Thu 06 February 2025 |
1704.96 (0.12%) |
1703.00 |
1703.00 - 1704.97 |
0.4694 times |
Fri 31 January 2025 |
1703.00 (1.01%) |
1686.00 |
1686.00 - 1704.98 |
2.3619 times |
Monthly price and charts 0ifl25 Strong monthly Stock price targets for 0ifl25 936826 are 1726.38 and 1770.26 | Monthly Target 1 | 1692.14 | | Monthly Target 2 | 1716.73 | | Monthly Target 3 | 1736.0166666667 | | Monthly Target 4 | 1760.61 | | Monthly Target 5 | 1779.9 |
Monthly price and volumes 0ifl25
| Date |
Closing |
Open |
Range |
Volume |
Fri 16 May 2025 |
1741.33 (0.3%) |
1735.70 |
1711.42 - 1755.30 |
3.141 times |
Wed 30 April 2025 |
1736.20 (0.36%) |
1725.18 |
1720.25 - 1739.78 |
2.2994 times |
Wed 26 March 2025 |
1729.95 (2.05%) |
1712.49 |
1712.49 - 1729.95 |
0.3882 times |
Fri 21 February 2025 |
1695.20 (-0.46%) |
1703.00 |
1690.20 - 1704.97 |
0.562 times |
Fri 31 January 2025 |
1703.00 (3.07%) |
1670.20 |
1670.20 - 1704.98 |
2.0062 times |
Mon 23 December 2024 |
1652.24 (8.34%) |
1652.24 |
1652.24 - 1652.24 |
0.0095 times |
Tue 19 November 2024 |
1525.00 (-7.01%) |
1660.00 |
1525.00 - 1660.00 |
0.7466 times |
Fri 27 September 2024 |
1640.00 (2.5%) |
1620.00 |
1500.36 - 1640.00 |
0.5497 times |
Fri 30 August 2024 |
1600.00 (-2.44%) |
1385.00 |
1385.00 - 1620.00 |
0.281 times |
Mon 29 July 2024 |
1639.99 (5.26%) |
1586.08 |
1586.08 - 1639.99 |
0.0163 times |
Wed 12 June 2024 |
1558.04 (-2.62%) |
1558.04 |
1558.04 - 1558.04 |
0.0054 times |
DMA SMA EMA moving averages of 0ifl25 936826
DMA (daily moving average) of 0ifl25 936826
| DMA period | DMA value | | 5 day DMA | 1744.78 | | 12 day DMA | 1739.24 | | 20 day DMA | 1731.88 | | 35 day DMA | 1707.01 | | 50 day DMA | 1674.01 | | 100 day DMA | 1572.54 | | 150 day DMA | 1438.2 | | 200 day DMA | | EMA (exponential moving average) of 0ifl25 936826
| EMA period | EMA current | EMA prev | EMA prev2 | | 5 day EMA | 1742.1 | 1742.48 | 1746.62 | | 12 day EMA | 1737.57 | 1736.89 | 1737.38 | | 20 day EMA | 1727.1 | 1725.6 | 1724.7 | | 35 day EMA | 1698.7 | 1696.19 | 1693.95 | | 50 day EMA | 1669.36 | 1666.42 | 1663.66 |
SMA (simple moving average) of 0ifl25 936826
| SMA period | SMA current | SMA prev | SMA prev2 | | 5 day SMA | 1744.78 | 1744.32 | 1744.62 | | 12 day SMA | 1739.24 | 1738.55 | 1737.99 | | 20 day SMA | 1731.88 | 1730.06 | 1728.59 | | 35 day SMA | 1707.01 | 1703.58 | 1700.66 | | 50 day SMA | 1674.01 | 1669.94 | 1665.81 | | 100 day SMA | 1572.54 | 1569.66 | 1565.91 | | 150 day SMA | 1438.2 | 1435.23 | 1431.33 | | 200 day SMA |
|
|
