97stfcl29 936460 full analysis,charts,indicators,moving averages,SMA,DMA,EMA,ADX,MACD,RSI97stfcl29 936460 WideScreen charts, DMA,SMA,EMA technical analysis, forecast prediction, by indicators ADX,MACD,RSI,CCI BSE stock exchange
Daily price and charts and targets 97stfcl29 Strong Daily Stock price targets for 97stfcl29 936460 are 1081 and 1104 | Daily Target 1 | 1077 | | Daily Target 2 | 1085 | | Daily Target 3 | 1100 | | Daily Target 4 | 1108 | | Daily Target 5 | 1123 |
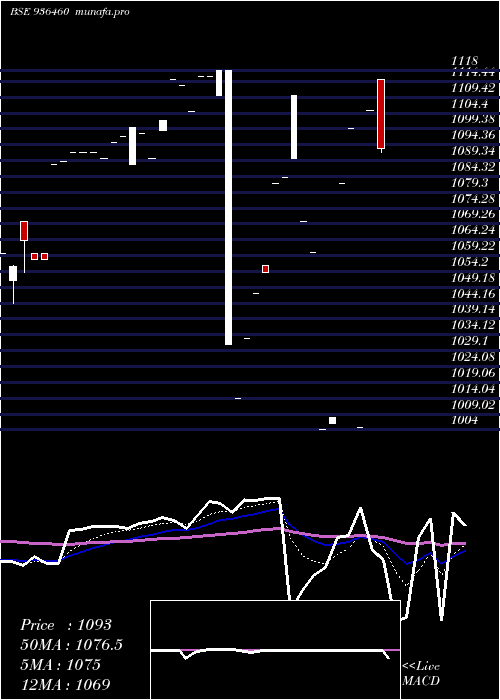
Daily price and volume 97stfcl29
| Date |
Closing |
Open |
Range |
Volume |
Fri 31 October 2025 |
1093.00 (-1.09%) |
1115.00 |
1092.00 - 1115.00 |
5.1348 times |
Thu 30 October 2025 |
1105.10 (10%) |
1105.10 |
1105.10 - 1105.10 |
2.0539 times |
Mon 22 September 2025 |
1004.66 (-8.63%) |
1004.66 |
1004.66 - 1004.66 |
0.1284 times |
Fri 19 September 2025 |
1099.60 (1.63%) |
1099.60 |
1099.60 - 1099.60 |
0.0642 times |
Thu 07 August 2025 |
1082.00 (7.34%) |
1082.00 |
1082.00 - 1082.00 |
0.3209 times |
Tue 29 July 2025 |
1008.00 (0.4%) |
1006.00 |
1006.00 - 1008.00 |
0.9628 times |
Mon 14 July 2025 |
1004.00 (-5.31%) |
1004.00 |
1004.00 - 1004.00 |
0.6418 times |
Tue 10 June 2025 |
1060.30 (-0.91%) |
1060.30 |
1060.30 - 1060.30 |
0.0128 times |
Mon 09 June 2025 |
1070.00 (-3.6%) |
1070.00 |
1070.00 - 1070.00 |
0.629 times |
Thu 29 May 2025 |
1110.00 (2.4%) |
1090.00 |
1090.00 - 1110.00 |
0.0513 times |
Mon 12 May 2025 |
1084.00 (0.18%) |
1084.00 |
1084.00 - 1084.00 |
0.0257 times |
Weekly price and charts 97stfcl29 Strong weekly Stock price targets for 97stfcl29 936460 are 1048.83 and 1159.17 | Weekly Target 1 | 960.55 | | Weekly Target 2 | 1026.77 | | Weekly Target 3 | 1070.8866666667 | | Weekly Target 4 | 1137.11 | | Weekly Target 5 | 1181.23 |
Weekly price and volumes for 97stfcl29
| Date |
Closing |
Open |
Range |
Volume |
Fri 31 October 2025 |
1093.00 (-0.6%) |
1004.66 |
1004.66 - 1115.00 |
5.0532 times |
Fri 19 September 2025 |
1099.60 (3.71%) |
1004.00 |
1004.00 - 1099.60 |
1.3741 times |
Tue 10 June 2025 |
1060.30 (-4.48%) |
1070.00 |
1060.30 - 1070.00 |
0.4433 times |
Thu 29 May 2025 |
1110.00 (2.59%) |
1084.00 |
1084.00 - 1110.00 |
0.0532 times |
Tue 06 May 2025 |
1082.00 (2.66%) |
1082.00 |
1082.00 - 1082.00 |
0.8865 times |
Thu 24 April 2025 |
1054.00 (2.03%) |
1047.12 |
1047.12 - 1056.00 |
0.5762 times |
Wed 19 February 2025 |
1033.00 (-7.6%) |
1013.80 |
1013.80 - 1033.00 |
0.4521 times |
Tue 21 January 2025 |
1118.00 (0%) |
1031.00 |
1031.00 - 1118.00 |
0.4521 times |
Thu 05 December 2024 |
1118.00 (1.18%) |
1116.01 |
1110.00 - 1118.00 |
0.2216 times |
Fri 22 November 2024 |
1105.00 (-0.9%) |
1113.00 |
1105.00 - 1113.00 |
0.4876 times |
Wed 30 October 2024 |
1115.00 (2.29%) |
1099.00 |
1099.00 - 1115.00 |
3.0142 times |

Monthly price and charts 97stfcl29 Strong monthly Stock price targets for 97stfcl29 936460 are 1081 and 1104 | Monthly Target 1 | 1077 | | Monthly Target 2 | 1085 | | Monthly Target 3 | 1100 | | Monthly Target 4 | 1108 | | Monthly Target 5 | 1123 |
Monthly price and volumes 97stfcl29
| Date |
Closing |
Open |
Range |
Volume |
Fri 31 October 2025 |
1093.00 (8.79%) |
1105.10 |
1092.00 - 1115.00 |
5.3435 times |
Mon 22 September 2025 |
1004.66 (-7.15%) |
1099.60 |
1004.66 - 1099.60 |
0.1431 times |
Thu 07 August 2025 |
1082.00 (7.34%) |
1082.00 |
1082.00 - 1082.00 |
0.2385 times |
Tue 29 July 2025 |
1008.00 (-4.93%) |
1004.00 |
1004.00 - 1008.00 |
1.1927 times |
Tue 10 June 2025 |
1060.30 (-4.48%) |
1070.00 |
1060.30 - 1070.00 |
0.4771 times |
Thu 29 May 2025 |
1110.00 (5.31%) |
1082.00 |
1082.00 - 1110.00 |
1.0115 times |
Thu 24 April 2025 |
1054.00 (0.66%) |
1056.00 |
1054.00 - 1056.00 |
0.5725 times |
Wed 12 March 2025 |
1047.12 (1.37%) |
1047.12 |
1047.12 - 1047.12 |
0.0477 times |
Wed 19 February 2025 |
1033.00 (-7.6%) |
1013.80 |
1013.80 - 1033.00 |
0.4866 times |
Tue 21 January 2025 |
1118.00 (0%) |
1031.00 |
1031.00 - 1118.00 |
0.4866 times |
Thu 05 December 2024 |
1118.00 (1.18%) |
1116.01 |
1110.00 - 1118.00 |
0.2385 times |

DMA SMA EMA moving averages of 97stfcl29 936460
DMA (daily moving average) of 97stfcl29 936460
| DMA period | DMA value | | 5 day DMA | 1076.87 | | 12 day DMA | 1066.89 | | 20 day DMA | 1070.93 | | 35 day DMA | 1082.18 | | 50 day DMA | 1074.58 | | 100 day DMA | 1084.3 | | 150 day DMA | 1076.73 | | 200 day DMA | 1064.68 | EMA (exponential moving average) of 97stfcl29 936460
| EMA period | EMA current | EMA prev | EMA prev2 | | 5 day EMA | 1075.03 | 1066.05 | 1046.53 | | 12 day EMA | 1068.96 | 1064.59 | 1057.23 | | 20 day EMA | 1070.68 | 1068.33 | 1064.46 | | 35 day EMA | 1070.19 | 1068.85 | 1066.72 | | 50 day EMA | 1073.33 | 1072.53 | 1071.2 |
SMA (simple moving average) of 97stfcl29 936460
| SMA period | SMA current | SMA prev | SMA prev2 | | 5 day SMA | 1076.87 | 1059.87 | 1039.65 | | 12 day SMA | 1066.89 | 1063.64 | 1058.81 | | 20 day SMA | 1070.93 | 1071.53 | 1071.93 | | 35 day SMA | 1082.18 | 1081.18 | 1079.83 | | 50 day SMA | 1074.58 | 1073.88 | 1072.92 | | 100 day SMA | 1084.3 | 1084.01 | 1083.46 | | 150 day SMA | 1076.73 | 1076 | 1075.2 | | 200 day SMA | 1064.68 | 1064.6 | 1064.45 |
|
|
