Mfl29nov18d 936374 full analysis,charts,indicators,moving averages,SMA,DMA,EMA,ADX,MACD,RSIMfl29nov18d 936374 WideScreen charts, DMA,SMA,EMA technical analysis, forecast prediction, by indicators ADX,MACD,RSI,CCI BSE stock exchange
Daily price and charts and targets Mfl29nov18d Strong Daily Stock price targets for Mfl29nov18d 936374 are 1972 and 1972 | Daily Target 1 | 1972 | | Daily Target 2 | 1972 | | Daily Target 3 | 1972 | | Daily Target 4 | 1972 | | Daily Target 5 | 1972 |
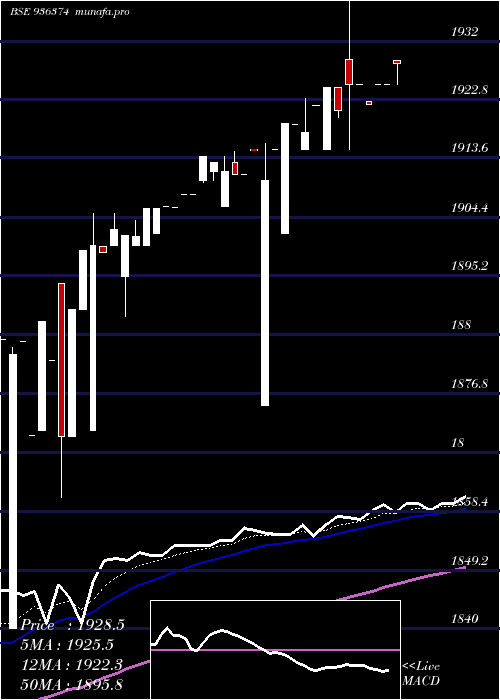
Daily price and volume Mfl29nov18d
| Date |
Closing |
Open |
Range |
Volume |
Fri 31 October 2025 |
1972.00 (0.04%) |
1972.00 |
1972.00 - 1972.00 |
1.165 times |
Thu 30 October 2025 |
1971.14 (0.08%) |
1970.00 |
1969.52 - 1972.00 |
0.6485 times |
Wed 29 October 2025 |
1969.50 (-0.03%) |
1972.00 |
1967.25 - 1972.00 |
1.1068 times |
Tue 28 October 2025 |
1970.00 (0.51%) |
1973.00 |
1970.00 - 1973.00 |
0.866 times |
Mon 27 October 2025 |
1960.05 (-0.25%) |
1972.00 |
1960.05 - 1972.00 |
2.0272 times |
Thu 23 October 2025 |
1965.00 (-0.15%) |
1995.00 |
1965.00 - 1995.00 |
0.0583 times |
Tue 21 October 2025 |
1968.00 (0.15%) |
1968.00 |
1968.00 - 1968.00 |
0.0777 times |
Mon 20 October 2025 |
1965.00 (0%) |
1970.00 |
1965.00 - 1970.00 |
0.6874 times |
Fri 17 October 2025 |
1965.00 (0.1%) |
1965.00 |
1964.90 - 1970.00 |
3.266 times |
Thu 16 October 2025 |
1963.00 (0.05%) |
1962.00 |
1962.00 - 1963.00 |
0.0971 times |
Wed 15 October 2025 |
1962.00 (0.1%) |
1962.00 |
1961.00 - 1962.00 |
0.5631 times |
Weekly price and charts Mfl29nov18d Strong weekly Stock price targets for Mfl29nov18d 936374 are 1965.53 and 1978.48 | Weekly Target 1 | 1955.4 | | Weekly Target 2 | 1963.7 | | Weekly Target 3 | 1968.35 | | Weekly Target 4 | 1976.65 | | Weekly Target 5 | 1981.3 |
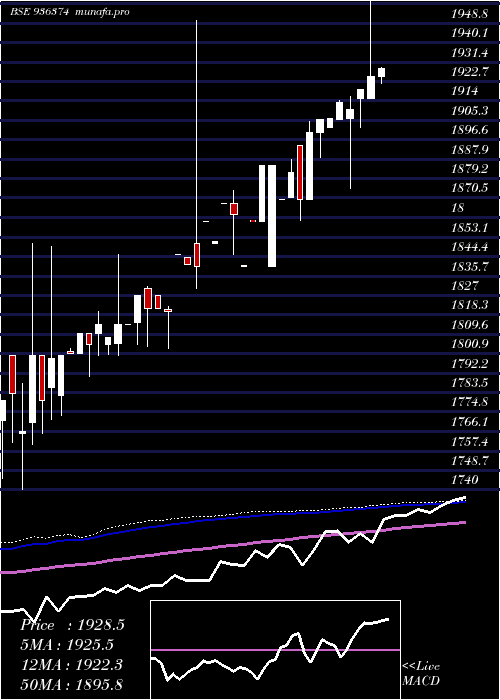
Weekly price and volumes for Mfl29nov18d
| Date |
Closing |
Open |
Range |
Volume |
Fri 31 October 2025 |
1972.00 (0.36%) |
1972.00 |
1960.05 - 1973.00 |
1.5198 times |
Thu 23 October 2025 |
1965.00 (0%) |
1970.00 |
1965.00 - 1995.00 |
0.2152 times |
Fri 17 October 2025 |
1965.00 (0.36%) |
1965.00 |
1945.00 - 1970.00 |
1.6386 times |
Fri 10 October 2025 |
1958.00 (0%) |
1963.00 |
1869.00 - 1967.00 |
2.2274 times |
Fri 03 October 2025 |
1958.00 (-0.23%) |
1955.00 |
1950.00 - 1959.99 |
1.2944 times |
Thu 25 September 2025 |
1962.59 (-0.02%) |
1968.50 |
1889.02 - 1968.50 |
0.997 times |
Thu 18 September 2025 |
1962.90 (0.35%) |
1957.80 |
1954.00 - 1964.00 |
1.3574 times |
Mon 08 September 2025 |
1956.00 (-0.03%) |
1956.00 |
1956.00 - 1956.00 |
0.0051 times |
Thu 04 September 2025 |
1956.50 (0.27%) |
1953.80 |
1946.00 - 1958.50 |
0.1716 times |
Thu 28 August 2025 |
1951.24 (0.01%) |
1948.00 |
1942.00 - 1957.80 |
0.5736 times |
Fri 22 August 2025 |
1951.00 (0.57%) |
1945.00 |
1920.00 - 1960.00 |
2.4701 times |
Monthly price and charts Mfl29nov18d Strong monthly Stock price targets for Mfl29nov18d 936374 are 1920.5 and 2046.5 | Monthly Target 1 | 1819.33 | | Monthly Target 2 | 1895.67 | | Monthly Target 3 | 1945.3333333333 | | Monthly Target 4 | 2021.67 | | Monthly Target 5 | 2071.33 |
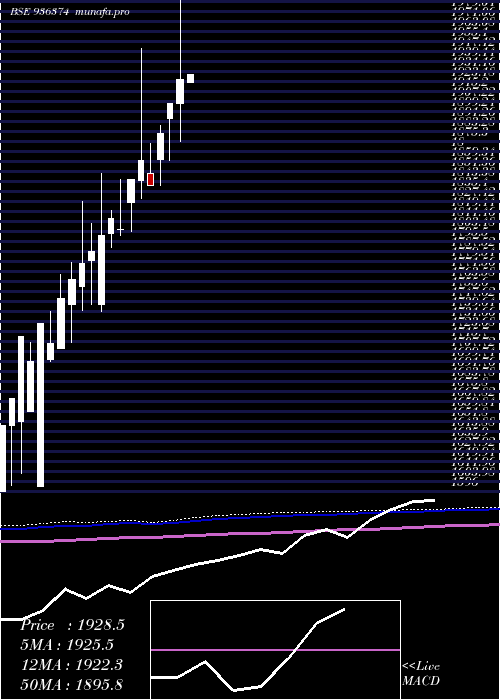
Monthly price and volumes Mfl29nov18d
| Date |
Closing |
Open |
Range |
Volume |
Fri 31 October 2025 |
1972.00 (1.13%) |
1955.01 |
1869.00 - 1995.00 |
1.8048 times |
Tue 30 September 2025 |
1950.00 (-0.06%) |
1953.80 |
1889.02 - 1968.50 |
0.7277 times |
Thu 28 August 2025 |
1951.24 (1.52%) |
1922.00 |
1920.00 - 1960.00 |
1.352 times |
Wed 30 July 2025 |
1922.00 (-0.16%) |
1922.50 |
1908.00 - 1959.95 |
0.713 times |
Mon 30 June 2025 |
1925.00 (1%) |
1905.90 |
1875.00 - 2265.00 |
2.4297 times |
Thu 29 May 2025 |
1906.00 (1.28%) |
1894.00 |
1860.47 - 1906.00 |
0.5761 times |
Wed 30 April 2025 |
1882.00 (2.27%) |
1860.60 |
1840.00 - 1888.00 |
0.4757 times |
Fri 28 March 2025 |
1840.25 (-1.06%) |
1850.00 |
1840.00 - 1874.00 |
0.4746 times |
Thu 20 February 2025 |
1860.00 (0.81%) |
1844.00 |
1830.10 - 1950.00 |
0.1276 times |
Thu 30 January 2025 |
1845.00 (2.21%) |
1827.10 |
1803.25 - 1845.00 |
1.3188 times |
Tue 31 December 2024 |
1805.10 (-0.48%) |
1805.00 |
1800.00 - 1845.00 |
0.5812 times |
DMA SMA EMA moving averages of Mfl29nov18d 936374
DMA (daily moving average) of Mfl29nov18d 936374
| DMA period | DMA value | | 5 day DMA | 1968.54 | | 12 day DMA | 1965.89 | | 20 day DMA | 1961.55 | | 35 day DMA | 1958.78 | | 50 day DMA | 1950.06 | | 100 day DMA | 1923.04 | | 150 day DMA | 1885.26 | | 200 day DMA | 1855.44 | EMA (exponential moving average) of Mfl29nov18d 936374
| EMA period | EMA current | EMA prev | EMA prev2 | | 5 day EMA | 1969.49 | 1968.23 | 1966.77 | | 12 day EMA | 1966.03 | 1964.94 | 1963.81 | | 20 day EMA | 1962.84 | 1961.88 | 1960.91 | | 35 day EMA | 1955.88 | 1954.93 | 1953.98 | | 50 day EMA | 1949.83 | 1948.93 | 1948.02 |
SMA (simple moving average) of Mfl29nov18d 936374
| SMA period | SMA current | SMA prev | SMA prev2 | | 5 day SMA | 1968.54 | 1967.14 | 1966.51 | | 12 day SMA | 1965.89 | 1963.94 | 1962.84 | | 20 day SMA | 1961.55 | 1961.08 | 1960.94 | | 35 day SMA | 1958.78 | 1957.95 | 1957.06 | | 50 day SMA | 1950.06 | 1949.12 | 1948.2 | | 100 day SMA | 1923.04 | 1921.72 | 1920.31 | | 150 day SMA | 1885.26 | 1883.88 | 1882.48 | | 200 day SMA | 1855.44 | 1854.33 | 1853.18 |
|
|
