729nabard26 935688 full analysis,charts,indicators,moving averages,SMA,DMA,EMA,ADX,MACD,RSI729nabard26 935688 WideScreen charts, DMA,SMA,EMA technical analysis, forecast prediction, by indicators ADX,MACD,RSI,CCI BSE stock exchange
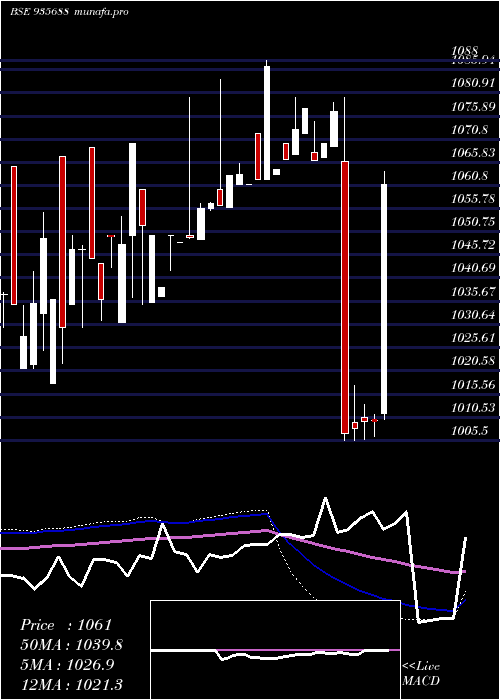
Daily price and charts and targets 729nabard26 Strong Daily Stock price targets for 729nabard26 935688 are 1048 and 1048 | Daily Target 1 | 1048 | | Daily Target 2 | 1048 | | Daily Target 3 | 1048 | | Daily Target 4 | 1048 | | Daily Target 5 | 1048 |
Daily price and volume 729nabard26
| Date |
Closing |
Open |
Range |
Volume |
Thu 13 November 2025 |
1048.00 (0.08%) |
1048.00 |
1048.00 - 1048.00 |
0.9395 times |
Tue 11 November 2025 |
1047.15 (-0.27%) |
1050.00 |
1047.15 - 1050.00 |
1.618 times |
Mon 10 November 2025 |
1049.99 (0.38%) |
1049.99 |
1049.99 - 1049.99 |
0.9812 times |
Tue 04 November 2025 |
1046.00 (0%) |
1046.00 |
1046.00 - 1046.00 |
0.5219 times |
Mon 03 November 2025 |
1046.00 (1.25%) |
1036.21 |
1033.11 - 1048.78 |
4.1754 times |
Wed 29 October 2025 |
1033.11 (-0.57%) |
1035.01 |
1033.11 - 1035.01 |
0.7829 times |
Mon 27 October 2025 |
1039.01 (0.1%) |
1039.02 |
1039.01 - 1039.02 |
0.9395 times |
Thu 23 October 2025 |
1038.00 (-0.1%) |
1038.00 |
1038.00 - 1038.00 |
0.0261 times |
Fri 17 October 2025 |
1039.00 (0.01%) |
1039.00 |
1039.00 - 1039.00 |
0.0104 times |
Tue 14 October 2025 |
1038.91 (-2.7%) |
1038.91 |
1038.91 - 1038.91 |
0.0052 times |
Mon 13 October 2025 |
1067.78 (2.01%) |
1044.00 |
1044.00 - 1067.78 |
1.4301 times |
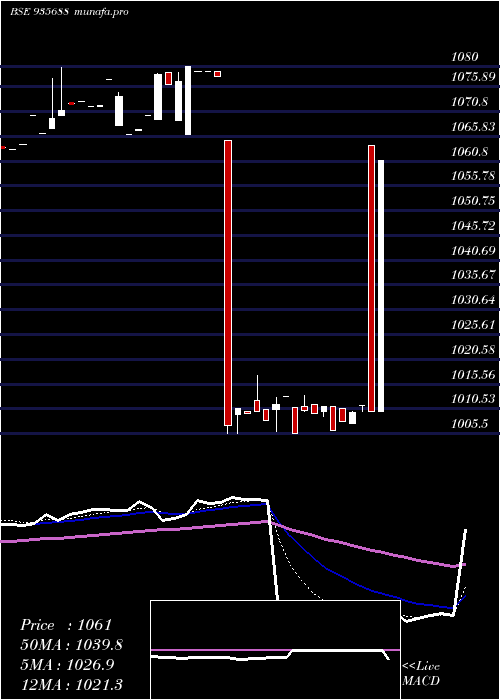
Weekly price and charts 729nabard26 Strong weekly Stock price targets for 729nabard26 935688 are 1046.15 and 1049 | Weekly Target 1 | 1045.53 | | Weekly Target 2 | 1046.77 | | Weekly Target 3 | 1048.3833333333 | | Weekly Target 4 | 1049.62 | | Weekly Target 5 | 1051.23 |
Weekly price and volumes for 729nabard26
| Date |
Closing |
Open |
Range |
Volume |
Thu 13 November 2025 |
1048.00 (0.19%) |
1049.99 |
1047.15 - 1050.00 |
0.8031 times |
Tue 04 November 2025 |
1046.00 (1.25%) |
1036.21 |
1033.11 - 1048.78 |
1.0661 times |
Wed 29 October 2025 |
1033.11 (-0.47%) |
1039.02 |
1033.11 - 1039.02 |
0.3909 times |
Thu 23 October 2025 |
1038.00 (-0.1%) |
1038.00 |
1038.00 - 1038.00 |
0.0059 times |
Fri 17 October 2025 |
1039.00 (-0.74%) |
1044.00 |
1038.91 - 1067.78 |
0.3281 times |
Fri 10 October 2025 |
1046.79 (0.69%) |
1005.50 |
1005.50 - 1069.00 |
2.131 times |
Thu 25 September 2025 |
1039.64 (1.12%) |
1039.64 |
1039.00 - 1039.64 |
0.764 times |
Tue 16 September 2025 |
1028.13 (-0.95%) |
1028.13 |
1028.13 - 1028.13 |
0.5923 times |
Fri 12 September 2025 |
1038.00 (1.62%) |
1027.12 |
1023.38 - 1038.99 |
1.5198 times |
Fri 29 August 2025 |
1021.50 (-0.73%) |
1021.28 |
1021.11 - 1022.30 |
2.3987 times |
Wed 13 August 2025 |
1029.00 (0.01%) |
1018.13 |
1018.13 - 1029.00 |
0.2464 times |
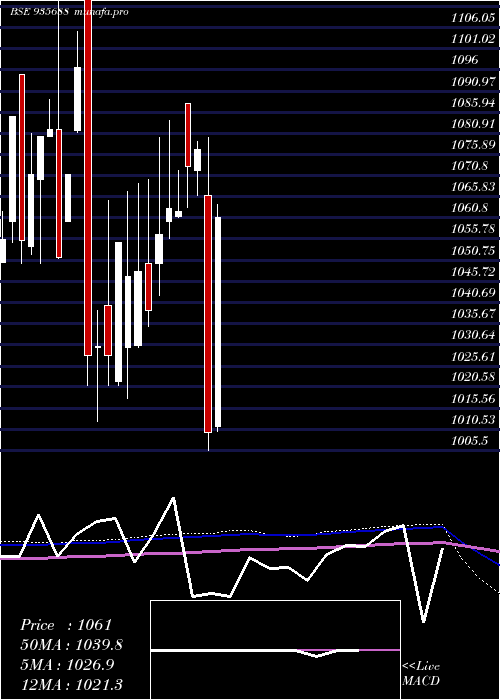
Monthly price and charts 729nabard26 Strong monthly Stock price targets for 729nabard26 935688 are 1040.56 and 1057.45 | Monthly Target 1 | 1026.81 | | Monthly Target 2 | 1037.41 | | Monthly Target 3 | 1043.7033333333 | | Monthly Target 4 | 1054.3 | | Monthly Target 5 | 1060.59 |
Monthly price and volumes 729nabard26
| Date |
Closing |
Open |
Range |
Volume |
Thu 13 November 2025 |
1048.00 (1.44%) |
1036.21 |
1033.11 - 1050.00 |
0.6154 times |
Wed 29 October 2025 |
1033.11 (-0.63%) |
1005.50 |
1005.50 - 1069.00 |
0.9403 times |
Thu 25 September 2025 |
1039.64 (1.78%) |
1027.12 |
1023.38 - 1039.64 |
0.947 times |
Fri 29 August 2025 |
1021.50 (-0.72%) |
1018.13 |
1018.13 - 1029.00 |
0.8709 times |
Tue 29 July 2025 |
1028.94 (0.09%) |
1027.00 |
992.94 - 1220.25 |
2.2387 times |
Mon 30 June 2025 |
1028.00 (0.98%) |
1018.00 |
1010.00 - 1043.99 |
0.5823 times |
Fri 30 May 2025 |
1018.00 (-0.78%) |
1024.99 |
1005.45 - 1059.00 |
0.3846 times |
Tue 29 April 2025 |
1025.99 (1.6%) |
1011.22 |
1008.00 - 1064.00 |
0.3409 times |
Fri 28 March 2025 |
1009.83 (-6.24%) |
1066.10 |
1005.50 - 1080.00 |
1.7598 times |
Fri 28 February 2025 |
1077.00 (0.37%) |
1071.99 |
1066.16 - 1078.86 |
1.3202 times |
Fri 31 January 2025 |
1073.00 (1.02%) |
1088.00 |
1063.12 - 1088.00 |
0.9434 times |
DMA SMA EMA moving averages of 729nabard26 935688
DMA (daily moving average) of 729nabard26 935688
| DMA period | DMA value | | 5 day DMA | 1047.43 | | 12 day DMA | 1044.98 | | 20 day DMA | 1042.67 | | 35 day DMA | 1035.53 | | 50 day DMA | 1036.6 | | 100 day DMA | 1030.34 | | 150 day DMA | 1040.29 | | 200 day DMA | 1038.92 | EMA (exponential moving average) of 729nabard26 935688
| EMA period | EMA current | EMA prev | EMA prev2 | | 5 day EMA | 1046.55 | 1045.82 | 1045.15 | | 12 day EMA | 1044.37 | 1043.71 | 1043.09 | | 20 day EMA | 1042.12 | 1041.5 | 1040.9 | | 35 day EMA | 1039.5 | 1039 | 1038.52 | | 50 day EMA | 1036.35 | 1035.87 | 1035.41 |
SMA (simple moving average) of 729nabard26 935688
| SMA period | SMA current | SMA prev | SMA prev2 | | 5 day SMA | 1047.43 | 1044.45 | 1042.82 | | 12 day SMA | 1044.98 | 1045.48 | 1045.05 | | 20 day SMA | 1042.67 | 1042.02 | 1041.6 | | 35 day SMA | 1035.53 | 1035.38 | 1040.33 | | 50 day SMA | 1036.6 | 1036.09 | 1035.64 | | 100 day SMA | 1030.34 | 1030.64 | 1030.87 | | 150 day SMA | 1040.29 | 1040.27 | 1040.16 | | 200 day SMA | 1038.92 | 1038.81 | 1038.71 |
|
|
