753ireda26 935616 full analysis,charts,indicators,moving averages,SMA,DMA,EMA,ADX,MACD,RSI753ireda26 935616 WideScreen charts, DMA,SMA,EMA technical analysis, forecast prediction, by indicators ADX,MACD,RSI,CCI BSE stock exchange
Daily price and charts and targets 753ireda26 Strong Daily Stock price targets for 753ireda26 935616 are 1061.15 and 1069.05 | Daily Target 1 | 1059.83 | | Daily Target 2 | 1062.47 | | Daily Target 3 | 1067.7333333333 | | Daily Target 4 | 1070.37 | | Daily Target 5 | 1075.63 |
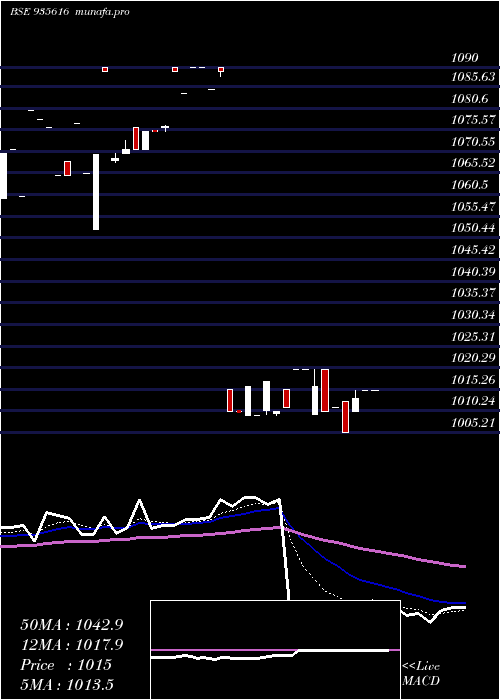
Daily price and volume 753ireda26
| Date |
Closing |
Open |
Range |
Volume |
Fri 19 December 2025 |
1065.10 (0.01%) |
1073.00 |
1065.10 - 1073.00 |
1.5398 times |
Wed 17 December 2025 |
1065.00 (-0.47%) |
1065.00 |
1065.00 - 1065.00 |
0.0895 times |
Tue 09 December 2025 |
1070.00 (0%) |
1070.00 |
1070.00 - 1070.00 |
0.009 times |
Fri 05 December 2025 |
1070.00 (0.28%) |
1070.00 |
1070.00 - 1070.00 |
0.5282 times |
Wed 03 December 2025 |
1067.00 (0.64%) |
1060.01 |
1060.00 - 1067.00 |
2.3993 times |
Tue 02 December 2025 |
1060.21 (-0.17%) |
1060.19 |
1060.18 - 1060.21 |
2.068 times |
Mon 01 December 2025 |
1062.02 (0%) |
1062.02 |
1062.01 - 1062.02 |
0.3671 times |
Fri 28 November 2025 |
1062.00 (-0.47%) |
1062.01 |
1062.00 - 1062.01 |
1.0654 times |
Thu 27 November 2025 |
1067.00 (0.95%) |
1062.00 |
1062.00 - 1067.00 |
1.4324 times |
Fri 14 November 2025 |
1057.00 (0.66%) |
1057.00 |
1057.00 - 1057.00 |
0.5013 times |
Wed 12 November 2025 |
1050.02 (-1.87%) |
1050.02 |
1050.02 - 1050.02 |
0.0269 times |
Weekly price and charts 753ireda26 Strong weekly Stock price targets for 753ireda26 935616 are 1061.05 and 1069.05 | Weekly Target 1 | 1059.7 | | Weekly Target 2 | 1062.4 | | Weekly Target 3 | 1067.7 | | Weekly Target 4 | 1070.4 | | Weekly Target 5 | 1075.7 |
Weekly price and volumes for 753ireda26
| Date |
Closing |
Open |
Range |
Volume |
Fri 19 December 2025 |
1065.10 (-0.46%) |
1070.00 |
1065.00 - 1073.00 |
0.6231 times |
Fri 05 December 2025 |
1070.00 (0.75%) |
1062.02 |
1060.00 - 1070.00 |
2.0395 times |
Fri 28 November 2025 |
1062.00 (0.47%) |
1062.00 |
1062.00 - 1067.00 |
0.9499 times |
Fri 14 November 2025 |
1057.00 (-1.21%) |
1050.02 |
1050.02 - 1057.00 |
0.2009 times |
Fri 07 November 2025 |
1070.00 (0.09%) |
1069.99 |
1069.99 - 1070.00 |
1.43 times |
Fri 31 October 2025 |
1068.99 (1.23%) |
1057.00 |
1057.00 - 1070.00 |
0.1055 times |
Thu 23 October 2025 |
1056.01 (0.95%) |
1055.01 |
1055.01 - 1056.01 |
0.0272 times |
Fri 10 October 2025 |
1046.12 (-1.31%) |
1053.07 |
1045.22 - 1053.07 |
0.8274 times |
Wed 01 October 2025 |
1060.00 (0.95%) |
1060.00 |
1060.00 - 1060.00 |
3.1256 times |
Fri 26 September 2025 |
1050.00 (-0.57%) |
1059.00 |
1050.00 - 1060.00 |
0.6708 times |
Thu 11 September 2025 |
1056.00 (-1.31%) |
1044.01 |
1044.01 - 1056.33 |
1.1679 times |

Monthly price and charts 753ireda26 Strong monthly Stock price targets for 753ireda26 935616 are 1062.55 and 1075.55 | Monthly Target 1 | 1053.03 | | Monthly Target 2 | 1059.07 | | Monthly Target 3 | 1066.0333333333 | | Monthly Target 4 | 1072.07 | | Monthly Target 5 | 1079.03 |
Monthly price and volumes 753ireda26
| Date |
Closing |
Open |
Range |
Volume |
Fri 19 December 2025 |
1065.10 (0.29%) |
1062.02 |
1060.00 - 1073.00 |
0.7063 times |
Fri 28 November 2025 |
1062.00 (-0.65%) |
1069.99 |
1050.02 - 1070.00 |
0.6846 times |
Fri 31 October 2025 |
1068.99 (1.81%) |
1060.00 |
1045.22 - 1070.00 |
1.0838 times |
Fri 26 September 2025 |
1050.00 (-1.87%) |
1044.01 |
1044.01 - 1060.00 |
0.4877 times |
Tue 26 August 2025 |
1070.00 (2.1%) |
1042.00 |
1042.00 - 1070.00 |
0.298 times |
Wed 30 July 2025 |
1048.00 (1.33%) |
1038.99 |
1030.21 - 1048.00 |
1.7034 times |
Mon 30 June 2025 |
1034.23 (-1.5%) |
1034.34 |
1022.13 - 1050.00 |
2.0475 times |
Tue 27 May 2025 |
1049.99 (1.79%) |
1031.64 |
1029.88 - 1050.00 |
0.5058 times |
Fri 25 April 2025 |
1031.50 (0.63%) |
1025.00 |
1020.00 - 1050.00 |
1.3033 times |
Fri 28 March 2025 |
1025.00 (0.84%) |
1020.00 |
1007.01 - 1025.00 |
1.1796 times |
Fri 28 February 2025 |
1016.50 (0.64%) |
1011.06 |
1005.21 - 1026.00 |
2.0349 times |

DMA SMA EMA moving averages of 753ireda26 935616
DMA (daily moving average) of 753ireda26 935616
| DMA period | DMA value | | 5 day DMA | 1067.42 | | 12 day DMA | 1063.78 | | 20 day DMA | 1062.08 | | 35 day DMA | 1058.48 | | 50 day DMA | 1052.65 | | 100 day DMA | 1038.17 | | 150 day DMA | 1046.43 | | 200 day DMA | 1046.46 | EMA (exponential moving average) of 753ireda26 935616
| EMA period | EMA current | EMA prev | EMA prev2 | | 5 day EMA | 1065.93 | 1066.35 | 1067.03 | | 12 day EMA | 1064.41 | 1064.28 | 1064.15 | | 20 day EMA | 1062.2 | 1061.89 | 1061.56 | | 35 day EMA | 1057.29 | 1056.83 | 1056.35 | | 50 day EMA | 1052.55 | 1052.04 | 1051.51 |
SMA (simple moving average) of 753ireda26 935616
| SMA period | SMA current | SMA prev | SMA prev2 | | 5 day SMA | 1067.42 | 1066.44 | 1065.85 | | 12 day SMA | 1063.78 | 1064.19 | 1064.52 | | 20 day SMA | 1062.08 | 1061.82 | 1061.07 | | 35 day SMA | 1058.48 | 1057.99 | 1057.4 | | 50 day SMA | 1052.65 | 1051.84 | 1051.33 | | 100 day SMA | 1038.17 | 1037.69 | 1037.13 | | 150 day SMA | 1046.43 | 1046.29 | 1046.14 | | 200 day SMA | 1046.46 | 1046.63 | 1046.81 |
|
|
