728ireda26 935610 full analysis,charts,indicators,moving averages,SMA,DMA,EMA,ADX,MACD,RSI728ireda26 935610 WideScreen charts, DMA,SMA,EMA technical analysis, forecast prediction, by indicators ADX,MACD,RSI,CCI BSE stock exchange
Daily price and charts and targets 728ireda26 Strong Daily Stock price targets for 728ireda26 935610 are 1053.52 and 1054.51 | Daily Target 1 | 1053.35 | | Daily Target 2 | 1053.68 | | Daily Target 3 | 1054.34 | | Daily Target 4 | 1054.67 | | Daily Target 5 | 1055.33 |
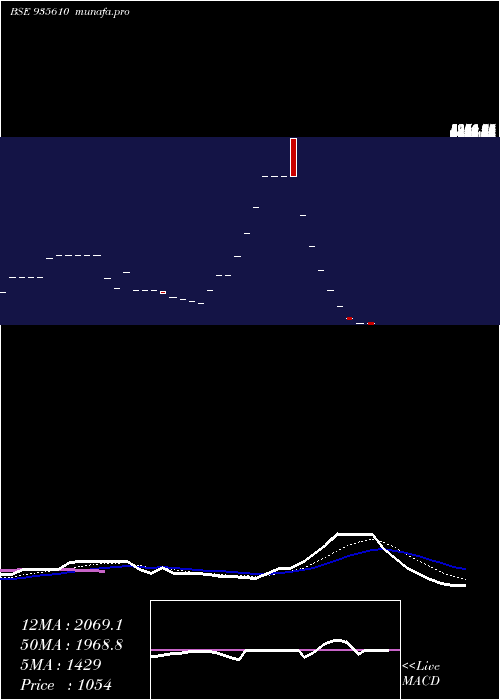
Daily price and volume 728ireda26
| Date |
Closing |
Open |
Range |
Volume |
Thu 20 November 2025 |
1054.01 (-0.28%) |
1055.00 |
1054.01 - 1055.00 |
2.0721 times |
Mon 17 November 2025 |
1057.00 (-8.5%) |
1053.00 |
1049.10 - 1057.00 |
5.4955 times |
Fri 14 November 2025 |
1155.20 (-20%) |
1165.00 |
1155.20 - 1165.00 |
0.6306 times |
Thu 13 November 2025 |
1444.00 (-20%) |
1444.00 |
1444.00 - 1444.00 |
0.3604 times |
Wed 12 November 2025 |
1805.00 (-19.92%) |
1805.00 |
1805.00 - 1805.00 |
0.2703 times |
Mon 10 November 2025 |
2254.00 (-19.99%) |
2254.00 |
2254.00 - 2254.00 |
0.2703 times |
Fri 07 November 2025 |
2817.00 (-19.99%) |
2817.00 |
2817.00 - 2817.00 |
0.0901 times |
Thu 06 November 2025 |
3521.00 (-20%) |
3521.00 |
3521.00 - 3521.00 |
0.0901 times |
Tue 04 November 2025 |
4401.00 (0.02%) |
5280.00 |
4401.00 - 5280.00 |
0.2703 times |
Fri 31 October 2025 |
4400.00 (0%) |
4400.00 |
4400.00 - 4400.00 |
0.4505 times |
Thu 30 October 2025 |
4400.00 (0%) |
4400.00 |
4400.00 - 4400.00 |
0.1802 times |
Weekly price and charts 728ireda26 Strong weekly Stock price targets for 728ireda26 935610 are 1051.56 and 1059.46 | Weekly Target 1 | 1045.47 | | Weekly Target 2 | 1049.74 | | Weekly Target 3 | 1053.37 | | Weekly Target 4 | 1057.64 | | Weekly Target 5 | 1061.27 |
Weekly price and volumes for 728ireda26
| Date |
Closing |
Open |
Range |
Volume |
Thu 20 November 2025 |
1054.01 (-8.76%) |
1053.00 |
1049.10 - 1057.00 |
5.7534 times |
Fri 14 November 2025 |
1155.20 (-58.99%) |
2254.00 |
1155.20 - 2254.00 |
1.1644 times |
Fri 07 November 2025 |
2817.00 (-35.98%) |
5280.00 |
2817.00 - 5280.00 |
0.3425 times |
Fri 31 October 2025 |
4400.00 (41.94%) |
3700.00 |
3700.00 - 4400.00 |
0.8904 times |
Fri 10 October 2025 |
3100.00 (43.92%) |
2584.00 |
2584.00 - 3100.00 |
0.137 times |
Fri 07 June 2024 |
2154.00 (43.7%) |
1795.00 |
1795.00 - 2154.00 |
0.274 times |
Fri 31 May 2024 |
1499.00 (-9.15%) |
1599.00 |
1499.00 - 1599.00 |
0.2055 times |
Fri 05 April 2024 |
1650.00 (-8.28%) |
1777.00 |
1650.00 - 1777.00 |
0.8219 times |
Thu 07 March 2024 |
1799.00 (-0.06%) |
1799.00 |
1799.00 - 1799.00 |
0.137 times |
Wed 28 February 2024 |
1800.00 (-13.5%) |
1850.00 |
1800.00 - 2215.00 |
0.274 times |
Mon 22 January 2024 |
2081.00 (-19.96%) |
2081.00 |
2081.00 - 2081.00 |
0.7534 times |

Monthly price and charts 728ireda26 Strong monthly Stock price targets for 728ireda26 935610 are -1063.9 and 3167.01 | Monthly Target 1 | -1769.86 | | Monthly Target 2 | -357.93 | | Monthly Target 3 | 2461.0366666667 | | Monthly Target 4 | 3872.97 | | Monthly Target 5 | 6691.94 |
Monthly price and volumes 728ireda26
| Date |
Closing |
Open |
Range |
Volume |
Thu 20 November 2025 |
1054.01 (-76.05%) |
5280.00 |
1049.10 - 5280.00 |
4.8848 times |
Fri 31 October 2025 |
4400.00 (70.28%) |
3100.00 |
3100.00 - 4400.00 |
0.6452 times |
Mon 26 August 2024 |
2584.00 (19.96%) |
2584.00 |
2584.00 - 2584.00 |
0.0461 times |
Fri 07 June 2024 |
2154.00 (43.7%) |
1795.00 |
1795.00 - 2154.00 |
0.1843 times |
Fri 31 May 2024 |
1499.00 (-3.6%) |
1499.00 |
1499.00 - 1499.00 |
0.0461 times |
Wed 24 April 2024 |
1555.00 (-13.56%) |
1777.00 |
1555.00 - 1777.00 |
0.6452 times |
Thu 07 March 2024 |
1799.00 (-0.06%) |
1799.00 |
1799.00 - 1799.00 |
0.0922 times |
Wed 28 February 2024 |
1800.00 (-13.5%) |
1850.00 |
1800.00 - 2215.00 |
0.1843 times |
Mon 22 January 2024 |
2081.00 (-19.96%) |
2081.00 |
2081.00 - 2081.00 |
0.5069 times |
Thu 14 December 2023 |
2599.99 (-0%) |
2610.00 |
2599.99 - 2610.00 |
2.765 times |
Wed 29 November 2023 |
2600.00 (23.14%) |
2111.50 |
2111.49 - 2600.00 |
0.1843 times |

DMA SMA EMA moving averages of 728ireda26 935610
DMA (daily moving average) of 728ireda26 935610
| DMA period | DMA value | | 5 day DMA | 1303.04 | | 12 day DMA | 2725.68 | | 20 day DMA | 2562.46 | | 35 day DMA | 2380.74 | | 50 day DMA | 2138.99 | | 100 day DMA | | | 150 day DMA | | | 200 day DMA | | EMA (exponential moving average) of 728ireda26 935610
| EMA period | EMA current | EMA prev | EMA prev2 | | 5 day EMA | 1428.96 | 1616.41 | 1896.07 | | 12 day EMA | 2069.09 | 2253.58 | 2471.06 | | 20 day EMA | 2258.77 | 2385.53 | 2525.31 | | 35 day EMA | 2234.33 | 2303.82 | 2377.22 | | 50 day EMA | 1981.2 | 2019.03 | 2058.28 |
SMA (simple moving average) of 728ireda26 935610
| SMA period | SMA current | SMA prev | SMA prev2 | | 5 day SMA | 1303.04 | 1543.04 | 1895.04 | | 12 day SMA | 2725.68 | 2946.18 | 3116.43 | | 20 day SMA | 2562.46 | 2589.71 | 2619.36 | | 35 day SMA | 2380.74 | 2410.96 | 2441.08 | | 50 day SMA | 2138.99 | 2150.12 | 2155.84 | | 100 day SMA | | 150 day SMA | | 200 day SMA |
|
|
