739nhai26 935580 full analysis,charts,indicators,moving averages,SMA,DMA,EMA,ADX,MACD,RSI739nhai26 935580 WideScreen charts, DMA,SMA,EMA technical analysis, forecast prediction, by indicators ADX,MACD,RSI,CCI BSE stock exchange
Daily price and charts and targets 739nhai26 Strong Daily Stock price targets for 739nhai26 935580 are 1052 and 1052 | Daily Target 1 | 1052 | | Daily Target 2 | 1052 | | Daily Target 3 | 1052 | | Daily Target 4 | 1052 | | Daily Target 5 | 1052 |
Daily price and volume 739nhai26
| Date |
Closing |
Open |
Range |
Volume |
Thu 27 November 2025 |
1052.00 (0.67%) |
1052.00 |
1052.00 - 1052.00 |
0.4735 times |
Mon 24 November 2025 |
1045.00 (-0.01%) |
1045.00 |
1045.00 - 1045.00 |
0.0473 times |
Thu 20 November 2025 |
1045.06 (-0.47%) |
1048.00 |
1045.06 - 1048.00 |
1.8939 times |
Mon 17 November 2025 |
1050.00 (0.1%) |
1050.00 |
1050.00 - 1050.00 |
0.6629 times |
Fri 14 November 2025 |
1049.00 (0%) |
1045.50 |
1045.50 - 1053.00 |
1.8371 times |
Thu 13 November 2025 |
1049.00 (0%) |
1049.00 |
1049.00 - 1049.00 |
0.0947 times |
Wed 12 November 2025 |
1049.00 (0.38%) |
1045.00 |
1045.00 - 1049.00 |
2.3674 times |
Thu 06 November 2025 |
1045.00 (0%) |
1053.00 |
1045.00 - 1053.00 |
2.178 times |
Wed 29 October 2025 |
1045.00 (0.38%) |
1045.00 |
1045.00 - 1045.00 |
0.4261 times |
Thu 23 October 2025 |
1041.00 (-0.76%) |
1041.00 |
1041.00 - 1041.00 |
0.0189 times |
Tue 21 October 2025 |
1048.98 (-0.1%) |
1048.99 |
1048.98 - 1048.99 |
1.8939 times |

Weekly price and charts 739nhai26 Strong weekly Stock price targets for 739nhai26 935580 are 1048.5 and 1055.5 | Weekly Target 1 | 1042.67 | | Weekly Target 2 | 1047.33 | | Weekly Target 3 | 1049.6666666667 | | Weekly Target 4 | 1054.33 | | Weekly Target 5 | 1056.67 |
Weekly price and volumes for 739nhai26
| Date |
Closing |
Open |
Range |
Volume |
Thu 27 November 2025 |
1052.00 (0.66%) |
1045.00 |
1045.00 - 1052.00 |
0.1472 times |
Thu 20 November 2025 |
1045.06 (-0.38%) |
1050.00 |
1045.06 - 1050.00 |
0.7225 times |
Fri 14 November 2025 |
1049.00 (0.38%) |
1045.00 |
1045.00 - 1053.00 |
1.2149 times |
Thu 06 November 2025 |
1045.00 (0.38%) |
1045.00 |
1045.00 - 1053.00 |
0.7359 times |
Thu 23 October 2025 |
1041.00 (0.19%) |
1049.99 |
1041.00 - 1049.99 |
1.0757 times |
Mon 13 October 2025 |
1039.00 (0%) |
1039.00 |
1039.00 - 1039.00 |
0.8215 times |
Fri 10 October 2025 |
1039.00 (0.55%) |
1044.00 |
1039.00 - 1044.00 |
1.1132 times |
Thu 25 September 2025 |
1033.34 (-0.54%) |
1034.60 |
1033.30 - 1035.00 |
0.7626 times |
Thu 11 September 2025 |
1038.99 (0.43%) |
1029.33 |
1029.33 - 1038.99 |
2.9971 times |
Thu 04 September 2025 |
1034.50 (1.12%) |
1030.00 |
1030.00 - 1034.50 |
0.4094 times |
Mon 11 August 2025 |
1023.02 (-0.68%) |
1023.01 |
1023.01 - 1025.02 |
2.684 times |
Monthly price and charts 739nhai26 Strong monthly Stock price targets for 739nhai26 935580 are 1044.5 and 1052.5 | Monthly Target 1 | 1042 | | Monthly Target 2 | 1047 | | Monthly Target 3 | 1050 | | Monthly Target 4 | 1055 | | Monthly Target 5 | 1058 |
Monthly price and volumes 739nhai26
| Date |
Closing |
Open |
Range |
Volume |
Thu 27 November 2025 |
1052.00 (0.67%) |
1053.00 |
1045.00 - 1053.00 |
0.3676 times |
Wed 29 October 2025 |
1045.00 (1.13%) |
1044.00 |
1039.00 - 1049.99 |
0.4263 times |
Thu 25 September 2025 |
1033.34 (1.01%) |
1030.00 |
1029.33 - 1038.99 |
0.5677 times |
Mon 11 August 2025 |
1023.02 (-0.29%) |
1030.00 |
1023.01 - 1030.00 |
0.4565 times |
Thu 31 July 2025 |
1026.00 (0.49%) |
1027.00 |
1019.02 - 1029.00 |
1.3372 times |
Thu 26 June 2025 |
1020.99 (0.1%) |
1020.00 |
1017.01 - 1030.00 |
0.5221 times |
Fri 30 May 2025 |
1020.00 (0.59%) |
1017.00 |
1012.01 - 1190.00 |
1.5525 times |
Wed 30 April 2025 |
1014.00 (0.96%) |
1005.56 |
1005.50 - 1017.48 |
1.9205 times |
Fri 28 March 2025 |
1004.31 (-6.66%) |
1073.01 |
1000.80 - 1077.49 |
2.6339 times |
Mon 24 February 2025 |
1076.00 (0.19%) |
1071.50 |
1071.20 - 1076.50 |
0.2157 times |
Tue 28 January 2025 |
1073.99 (-0.03%) |
1062.19 |
1062.19 - 1075.00 |
1.9034 times |
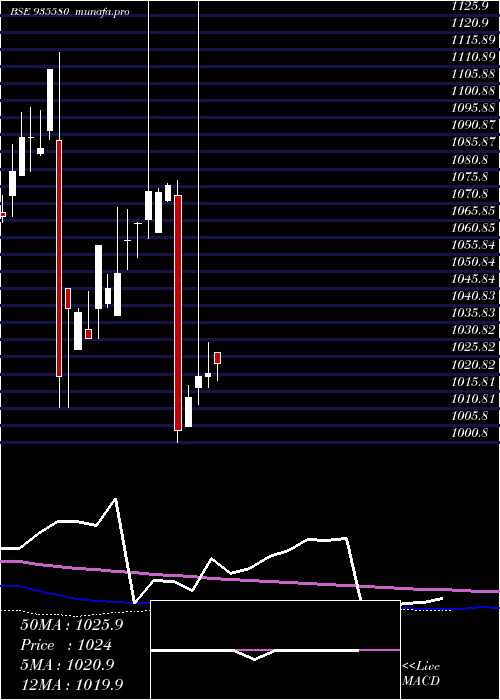
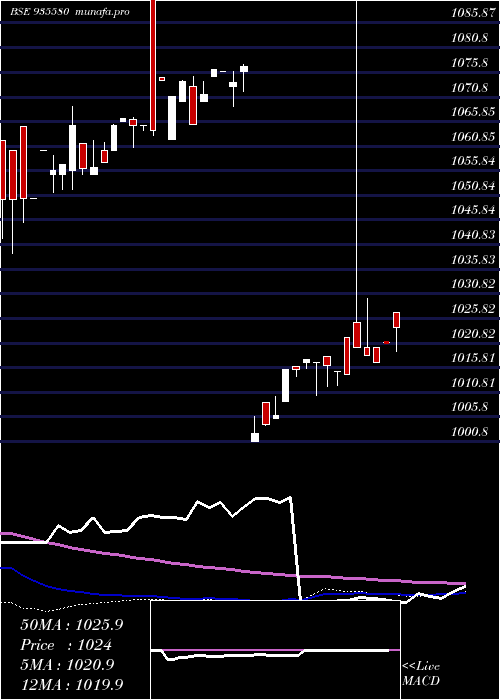
DMA SMA EMA moving averages of 739nhai26 935580
DMA (daily moving average) of 739nhai26 935580
| DMA period | DMA value | | 5 day DMA | 1048.21 | | 12 day DMA | 1047.42 | | 20 day DMA | 1043.12 | | 35 day DMA | 1036.38 | | 50 day DMA | 1031.49 | | 100 day DMA | 1035 | | 150 day DMA | 1042.5 | | 200 day DMA | 1044.14 | EMA (exponential moving average) of 739nhai26 935580
| EMA period | EMA current | EMA prev | EMA prev2 | | 5 day EMA | 1048.35 | 1046.52 | 1047.28 | | 12 day EMA | 1046.13 | 1045.06 | 1045.07 | | 20 day EMA | 1043.03 | 1042.09 | 1041.78 | | 35 day EMA | 1037.59 | 1036.74 | 1036.25 | | 50 day EMA | 1031.75 | 1030.92 | 1030.35 |
SMA (simple moving average) of 739nhai26 935580
| SMA period | SMA current | SMA prev | SMA prev2 | | 5 day SMA | 1048.21 | 1047.61 | 1048.41 | | 12 day SMA | 1047.42 | 1046.34 | 1045.84 | | 20 day SMA | 1043.12 | 1041.99 | 1041.46 | | 35 day SMA | 1036.38 | 1035.44 | 1034.76 | | 50 day SMA | 1031.49 | 1030.75 | 1030.15 | | 100 day SMA | 1035 | 1035.22 | 1035.41 | | 150 day SMA | 1042.5 | 1042.48 | 1042.45 | | 200 day SMA | 1044.14 | 1044.36 | 1044.57 |
|
|
