728irfc30 935568 full analysis,charts,indicators,moving averages,SMA,DMA,EMA,ADX,MACD,RSI728irfc30 935568 WideScreen charts, DMA,SMA,EMA technical analysis, forecast prediction, by indicators ADX,MACD,RSI,CCI BSE stock exchange
Daily price and charts and targets 728irfc30 Strong Daily Stock price targets for 728irfc30 935568 are 1105 and 1105 | Daily Target 1 | 1105 | | Daily Target 2 | 1105 | | Daily Target 3 | 1105 | | Daily Target 4 | 1105 | | Daily Target 5 | 1105 |
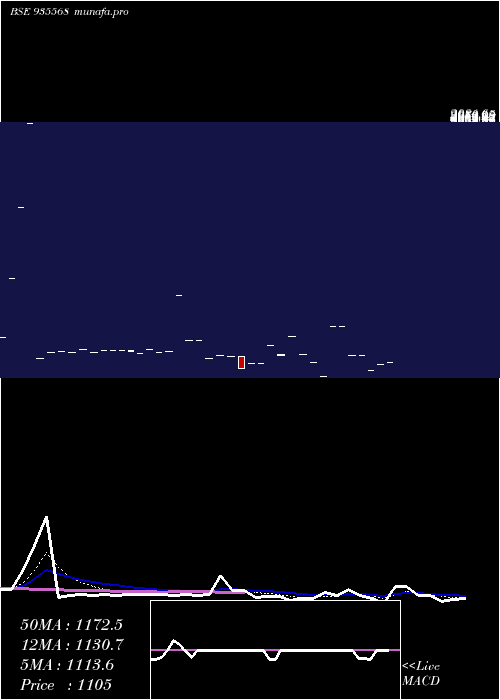
Daily price and volume 728irfc30
| Date |
Closing |
Open |
Range |
Volume |
Fri 19 December 2025 |
1105.00 (0.73%) |
1105.00 |
1105.00 - 1105.00 |
0.0054 times |
Tue 28 October 2025 |
1097.00 (2.43%) |
1095.00 |
1095.00 - 1097.00 |
0.036 times |
Tue 30 September 2025 |
1071.00 (-5.58%) |
1071.00 |
1071.00 - 1071.00 |
0.0004 times |
Thu 29 May 2025 |
1134.27 (0%) |
1134.27 |
1134.27 - 1134.27 |
0.0036 times |
Tue 22 April 2025 |
1134.27 (-9.25%) |
1134.27 |
1134.27 - 1134.27 |
0.7192 times |
Mon 21 April 2025 |
1249.90 (0%) |
1249.90 |
1249.90 - 1249.90 |
0.009 times |
Tue 28 January 2025 |
1249.90 (19.57%) |
1249.90 |
1249.90 - 1249.90 |
0.0245 times |
Mon 27 January 2025 |
1045.30 (-5.26%) |
1045.30 |
1045.30 - 1045.30 |
0.1557 times |
Thu 03 October 2024 |
1103.29 (-2.79%) |
1103.29 |
1103.29 - 1103.29 |
0.3582 times |
Fri 27 September 2024 |
1135.00 (-6.2%) |
1135.00 |
1135.00 - 1135.00 |
8.6881 times |
Wed 25 September 2024 |
1210.00 (6.61%) |
1210.00 |
1210.00 - 1210.00 |
8.6881 times |
Weekly price and charts 728irfc30 Strong weekly Stock price targets for 728irfc30 935568 are 1100 and 1110 | Weekly Target 1 | 1091.67 | | Weekly Target 2 | 1098.33 | | Weekly Target 3 | 1101.6666666667 | | Weekly Target 4 | 1108.33 | | Weekly Target 5 | 1111.67 |
Weekly price and volumes for 728irfc30
| Date |
Closing |
Open |
Range |
Volume |
Fri 19 December 2025 |
1105.00 (3.17%) |
1095.00 |
1095.00 - 1105.00 |
0.0083 times |
Tue 30 September 2025 |
1071.00 (-5.58%) |
1071.00 |
1071.00 - 1071.00 |
0.0001 times |
Thu 29 May 2025 |
1134.27 (-9.25%) |
1249.90 |
1134.27 - 1249.90 |
0.147 times |
Tue 28 January 2025 |
1249.90 (13.29%) |
1045.30 |
1045.30 - 1249.90 |
0.0362 times |
Thu 03 October 2024 |
1103.29 (-2.79%) |
1103.29 |
1103.29 - 1103.29 |
0.0719 times |
Fri 27 September 2024 |
1135.00 (-3.22%) |
1133.62 |
1133.62 - 1210.00 |
5.2346 times |
Wed 21 August 2024 |
1172.79 (6.66%) |
1100.10 |
1100.10 - 1172.79 |
0.0433 times |
Fri 16 August 2024 |
1099.60 (-3.02%) |
1128.01 |
1080.00 - 1128.10 |
0.1215 times |
Mon 05 February 2024 |
1133.85 (1.35%) |
1133.85 |
1133.85 - 1133.85 |
3.8966 times |
Wed 22 November 2023 |
1118.78 (-18.92%) |
1196.12 |
1118.78 - 1196.12 |
0.4406 times |
Fri 26 May 2023 |
1379.90 (20.93%) |
1156.00 |
1145.35 - 1379.90 |
0.1709 times |

Monthly price and charts 728irfc30 Strong monthly Stock price targets for 728irfc30 935568 are 1105 and 1105 | Monthly Target 1 | 1105 | | Monthly Target 2 | 1105 | | Monthly Target 3 | 1105 | | Monthly Target 4 | 1105 | | Monthly Target 5 | 1105 |
Monthly price and volumes 728irfc30
| Date |
Closing |
Open |
Range |
Volume |
Fri 19 December 2025 |
1105.00 (0.73%) |
1105.00 |
1105.00 - 1105.00 |
0.0011 times |
Tue 28 October 2025 |
1097.00 (2.43%) |
1095.00 |
1095.00 - 1097.00 |
0.0076 times |
Tue 30 September 2025 |
1071.00 (-5.58%) |
1071.00 |
1071.00 - 1071.00 |
0.0001 times |
Thu 29 May 2025 |
1134.27 (0%) |
1134.27 |
1134.27 - 1134.27 |
0.0008 times |
Tue 22 April 2025 |
1134.27 (-9.25%) |
1249.90 |
1134.27 - 1249.90 |
0.153 times |
Tue 28 January 2025 |
1249.90 (13.29%) |
1045.30 |
1045.30 - 1249.90 |
0.0379 times |
Thu 03 October 2024 |
1103.29 (-2.79%) |
1103.29 |
1103.29 - 1103.29 |
0.0752 times |
Fri 27 September 2024 |
1135.00 (-3.22%) |
1133.62 |
1133.62 - 1210.00 |
5.4759 times |
Wed 21 August 2024 |
1172.79 (8.59%) |
1099.60 |
1099.60 - 1172.79 |
0.0496 times |
Thu 22 February 2024 |
1080.00 (-3.47%) |
1133.85 |
1080.00 - 1133.85 |
4.1989 times |
Wed 22 November 2023 |
1118.78 (-6.46%) |
1118.78 |
1118.78 - 1118.78 |
0.2266 times |

DMA SMA EMA moving averages of 728irfc30 935568
DMA (daily moving average) of 728irfc30 935568
| DMA period | DMA value | | 5 day DMA | 1108.31 | | 12 day DMA | 1139.16 | | 20 day DMA | 1134.96 | | 35 day DMA | 1149.16 | | 50 day DMA | 1201.34 | | 100 day DMA | | | 150 day DMA | | | 200 day DMA | | EMA (exponential moving average) of 728irfc30 935568
| EMA period | EMA current | EMA prev | EMA prev2 | | 5 day EMA | 1113.61 | 1117.92 | 1128.38 | | 12 day EMA | 1130.72 | 1135.39 | 1142.37 | | 20 day EMA | 1142.01 | 1145.9 | 1151.05 | | 35 day EMA | 1169.14 | 1172.92 | 1177.39 | | 50 day EMA | 1195.59 | 1199.29 | 1203.46 |
SMA (simple moving average) of 728irfc30 935568
| SMA period | SMA current | SMA prev | SMA prev2 | | 5 day SMA | 1108.31 | 1137.29 | 1167.87 | | 12 day SMA | 1139.16 | 1144.81 | 1145.07 | | 20 day SMA | 1134.96 | 1139.51 | 1153.66 | | 35 day SMA | 1149.16 | 1149.56 | 1177.77 | | 50 day SMA | 1201.34 | 1203.89 | 1206.31 | | 100 day SMA | | 150 day SMA | | 200 day SMA |
|
|
