InfibeamAvenues 890219 full analysis,charts,indicators,moving averages,SMA,DMA,EMA,ADX,MACD,RSIInfibeam Avenues 890219 WideScreen charts, DMA,SMA,EMA technical analysis, forecast prediction, by indicators ADX,MACD,RSI,CCI BSE stock exchange
Daily price and charts and targets InfibeamAvenues Strong Daily Stock price targets for InfibeamAvenues 890219 are 12.55 and 12.8 | Daily Target 1 | 12.36 | | Daily Target 2 | 12.48 | | Daily Target 3 | 12.61 | | Daily Target 4 | 12.73 | | Daily Target 5 | 12.86 |
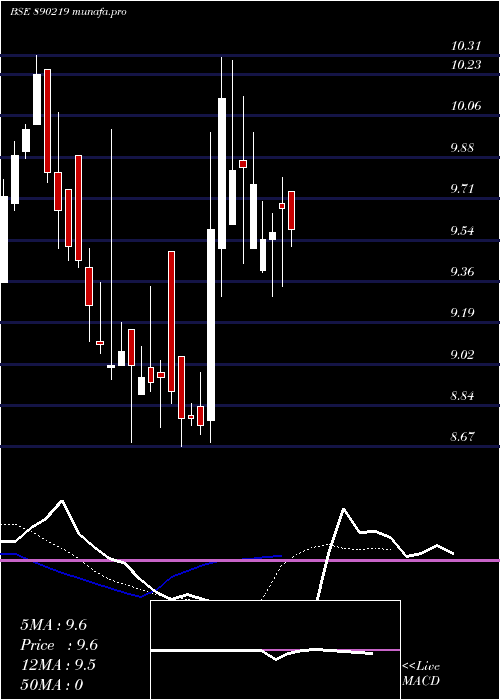
Daily price and volume Infibeam Avenues
| Date |
Closing |
Open |
Range |
Volume |
Fri 31 October 2025 |
12.60 (0.48%) |
12.56 |
12.49 - 12.74 |
1.0084 times |
Thu 30 October 2025 |
12.54 (0.8%) |
12.51 |
12.38 - 12.86 |
1.715 times |
Wed 29 October 2025 |
12.44 (4.27%) |
11.82 |
11.75 - 12.55 |
2.2177 times |
Tue 28 October 2025 |
11.93 (1.1%) |
11.68 |
11.68 - 12.14 |
0.8353 times |
Mon 27 October 2025 |
11.80 (-1.91%) |
11.65 |
11.55 - 12.20 |
0.5717 times |
Thu 23 October 2025 |
12.03 (0%) |
12.03 |
11.95 - 12.28 |
1.1582 times |
Tue 21 October 2025 |
12.03 (0.33%) |
12.00 |
11.78 - 12.17 |
0.2928 times |
Mon 20 October 2025 |
11.99 (0.76%) |
11.99 |
11.77 - 12.10 |
0.3376 times |
Fri 17 October 2025 |
11.90 (0.17%) |
11.84 |
11.82 - 12.39 |
0.9354 times |
Thu 16 October 2025 |
11.88 (0.68%) |
11.61 |
11.33 - 12.18 |
0.9278 times |
Wed 15 October 2025 |
11.80 (-1.67%) |
11.88 |
11.61 - 12.24 |
0.7309 times |
Weekly price and charts InfibeamAvenues Strong weekly Stock price targets for InfibeamAvenues 890219 are 12.08 and 13.39 | Weekly Target 1 | 11.03 | | Weekly Target 2 | 11.81 | | Weekly Target 3 | 12.336666666667 | | Weekly Target 4 | 13.12 | | Weekly Target 5 | 13.65 |
Weekly price and volumes for Infibeam Avenues
| Date |
Closing |
Open |
Range |
Volume |
Fri 31 October 2025 |
12.60 (4.74%) |
11.65 |
11.55 - 12.86 |
1.0459 times |
Thu 23 October 2025 |
12.03 (1.09%) |
11.99 |
11.77 - 12.28 |
0.2947 times |
Fri 17 October 2025 |
11.90 (-4.8%) |
12.51 |
11.33 - 12.68 |
0.5976 times |
Fri 10 October 2025 |
12.50 (22.31%) |
10.25 |
10.01 - 12.79 |
2.0093 times |
Fri 03 October 2025 |
10.22 (2.82%) |
9.90 |
9.50 - 10.23 |
0.3803 times |
Fri 26 September 2025 |
9.94 (-2.55%) |
10.03 |
9.85 - 10.55 |
0.8855 times |
Fri 19 September 2025 |
10.20 (2.82%) |
9.75 |
9.75 - 10.36 |
1.3493 times |
Fri 12 September 2025 |
9.92 (-0.4%) |
9.50 |
9.50 - 10.30 |
1.4755 times |
Fri 05 September 2025 |
9.96 (3%) |
9.74 |
9.51 - 10.14 |
1.5142 times |
Fri 29 August 2025 |
9.67 (-1.73%) |
9.50 |
9.30 - 9.99 |
0.4477 times |
Fri 22 August 2025 |
9.84 (11.95%) |
8.84 |
8.69 - 10.30 |
2.4006 times |

Monthly price and charts InfibeamAvenues Strong monthly Stock price targets for InfibeamAvenues 890219 are 11.05 and 14.41 | Monthly Target 1 | 8.29 | | Monthly Target 2 | 10.45 | | Monthly Target 3 | 11.653333333333 | | Monthly Target 4 | 13.81 | | Monthly Target 5 | 15.01 |
Monthly price and volumes Infibeam Avenues
| Date |
Closing |
Open |
Range |
Volume |
Fri 31 October 2025 |
12.60 (27.14%) |
10.00 |
9.50 - 12.86 |
0.794 times |
Tue 30 September 2025 |
9.91 (2.48%) |
9.74 |
9.50 - 10.55 |
0.998 times |
Fri 29 August 2025 |
9.67 (4.43%) |
9.11 |
8.67 - 10.30 |
0.9972 times |
Thu 31 July 2025 |
9.26 (0%) |
9.36 |
9.11 - 10.31 |
1.2108 times |
Fri 31 October 2025 |
(0%) |
|
- |
0 times |

DMA SMA EMA moving averages of Infibeam Avenues 890219
DMA (daily moving average) of Infibeam Avenues 890219
| DMA period | DMA value | | 5 day DMA | 12.26 | | 12 day DMA | 12.08 | | 20 day DMA | 11.79 | | 35 day DMA | 11.05 | | 50 day DMA | 10.67 | | 100 day DMA | | | 150 day DMA | | | 200 day DMA | | EMA (exponential moving average) of Infibeam Avenues 890219
| EMA period | EMA current | EMA prev | EMA prev2 | | 5 day EMA | 12.36 | 12.24 | 12.09 | | 12 day EMA | 12.07 | 11.97 | 11.87 | | 20 day EMA | 11.75 | 11.66 | 11.57 | | 35 day EMA | 11.24 | 11.16 | 11.08 | | 50 day EMA | 10.69 | 10.61 | 10.53 |
SMA (simple moving average) of Infibeam Avenues 890219
| SMA period | SMA current | SMA prev | SMA prev2 | | 5 day SMA | 12.26 | 12.15 | 12.05 | | 12 day SMA | 12.08 | 12.05 | 12.05 | | 20 day SMA | 11.79 | 11.65 | 11.51 | | 35 day SMA | 11.05 | 10.97 | 10.9 | | 50 day SMA | 10.67 | 10.6 | 10.52 | | 100 day SMA | | 150 day SMA | | 200 day SMA |
|
|
