772gs2055 800250 full analysis,charts,indicators,moving averages,SMA,DMA,EMA,ADX,MACD,RSI772gs2055 800250 WideScreen charts, DMA,SMA,EMA technical analysis, forecast prediction, by indicators ADX,MACD,RSI,CCI BSE stock exchange
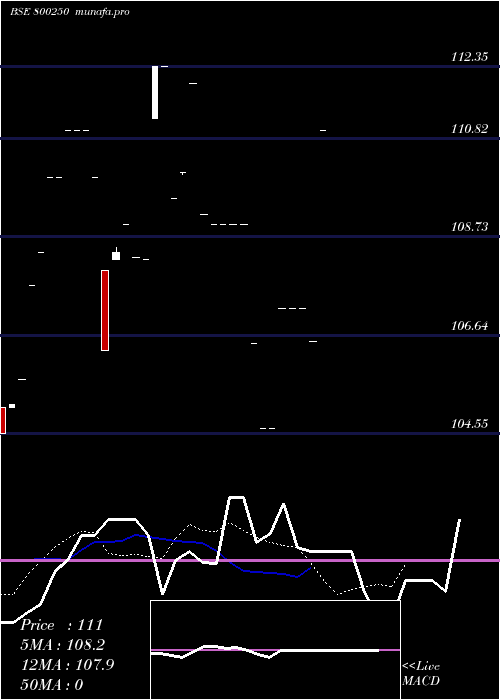
Daily price and charts and targets 772gs2055 Strong Daily Stock price targets for 772gs2055 800250 are 111 and 111 | Daily Target 1 | 111 | | Daily Target 2 | 111 | | Daily Target 3 | 111 | | Daily Target 4 | 111 | | Daily Target 5 | 111 |
Daily price and volume 772gs2055
| Date |
Closing |
Open |
Range |
Volume |
Wed 26 November 2025 |
111.00 (4.23%) |
111.00 |
111.00 - 111.00 |
0.0041 times |
Tue 28 October 2025 |
106.50 (-0.65%) |
106.50 |
106.50 - 106.50 |
1.0196 times |
Mon 20 October 2025 |
107.20 (0%) |
107.20 |
107.20 - 107.20 |
0.4078 times |
Fri 17 October 2025 |
107.20 (0%) |
107.20 |
107.20 - 107.20 |
0.5098 times |
Thu 16 October 2025 |
107.20 (2.44%) |
107.20 |
107.20 - 107.20 |
1.2582 times |
Mon 15 September 2025 |
104.65 (0%) |
104.65 |
104.65 - 104.65 |
0.0958 times |
Thu 04 September 2025 |
104.65 (-1.69%) |
104.65 |
104.65 - 104.65 |
0.1285 times |
Wed 09 July 2025 |
106.45 (-2.34%) |
106.45 |
106.45 - 106.45 |
0.0469 times |
Mon 30 June 2025 |
109.00 (0%) |
109.00 |
109.00 - 109.00 |
4.4902 times |
Thu 26 June 2025 |
109.00 (0%) |
109.00 |
109.00 - 109.00 |
2.0392 times |
Tue 03 June 2025 |
109.00 (0%) |
109.00 |
109.00 - 109.00 |
0.002 times |
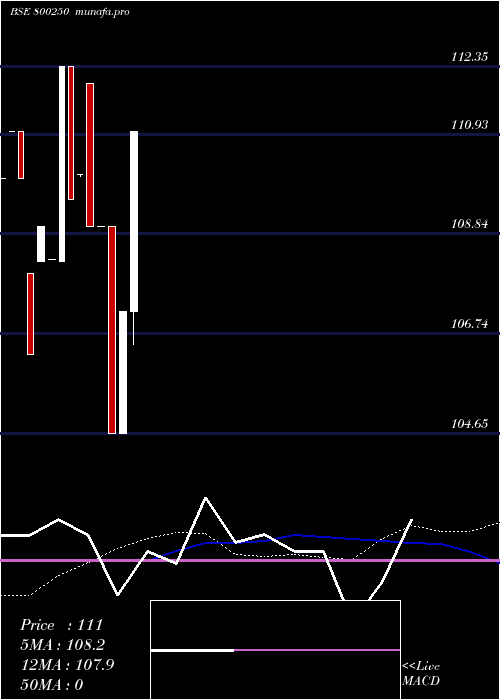
Weekly price and charts 772gs2055 Strong weekly Stock price targets for 772gs2055 800250 are 108.75 and 113.25 | Weekly Target 1 | 105 | | Weekly Target 2 | 108 | | Weekly Target 3 | 109.5 | | Weekly Target 4 | 112.5 | | Weekly Target 5 | 114 |
Weekly price and volumes for 772gs2055
| Date |
Closing |
Open |
Range |
Volume |
Wed 26 November 2025 |
111.00 (3.54%) |
107.20 |
106.50 - 111.00 |
0.7915 times |
Fri 17 October 2025 |
107.20 (2.44%) |
104.65 |
104.65 - 107.20 |
1.0306 times |
Thu 04 September 2025 |
104.65 (-3.99%) |
109.00 |
104.65 - 109.00 |
2.5798 times |
Thu 26 June 2025 |
109.00 (0%) |
109.00 |
109.00 - 109.00 |
1.1287 times |
Thu 15 May 2025 |
109.00 (-1%) |
112.00 |
109.00 - 112.00 |
2.2505 times |
Tue 15 April 2025 |
110.10 (0.5%) |
110.10 |
110.05 - 110.10 |
0.0147 times |
Fri 11 April 2025 |
109.55 (-2.49%) |
112.35 |
109.55 - 112.35 |
0.1533 times |
Wed 02 April 2025 |
112.35 (3.74%) |
108.25 |
108.25 - 112.35 |
0.0124 times |
Tue 11 March 2025 |
108.30 (-0.64%) |
108.30 |
108.30 - 108.30 |
1.1275 times |
Wed 29 January 2025 |
109.00 (2.54%) |
108.25 |
108.25 - 109.00 |
0.911 times |
Thu 23 January 2025 |
106.30 (-3.36%) |
108.00 |
106.30 - 108.00 |
0.9009 times |
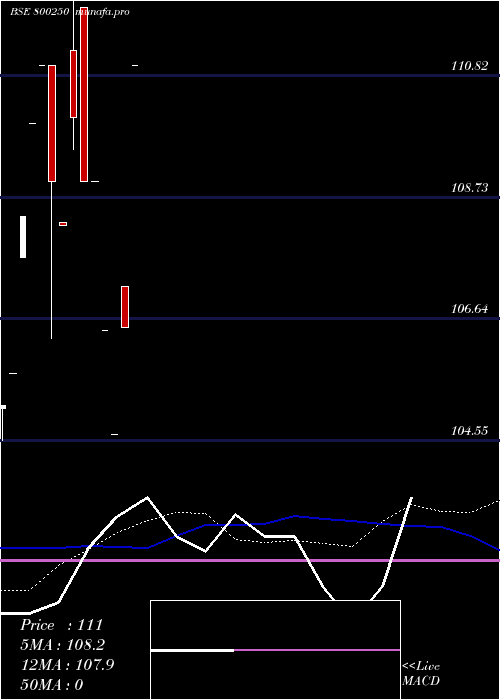
Monthly price and charts 772gs2055 Strong monthly Stock price targets for 772gs2055 800250 are 111 and 111 | Monthly Target 1 | 111 | | Monthly Target 2 | 111 | | Monthly Target 3 | 111 | | Monthly Target 4 | 111 | | Monthly Target 5 | 111 |
Monthly price and volumes 772gs2055
| Date |
Closing |
Open |
Range |
Volume |
Wed 26 November 2025 |
111.00 (4.23%) |
111.00 |
111.00 - 111.00 |
0.0021 times |
Tue 28 October 2025 |
106.50 (1.77%) |
107.20 |
106.50 - 107.20 |
1.6135 times |
Mon 15 September 2025 |
104.65 (-1.69%) |
104.65 |
104.65 - 104.65 |
0.1133 times |
Wed 09 July 2025 |
106.45 (-2.34%) |
106.45 |
106.45 - 106.45 |
0.0237 times |
Mon 30 June 2025 |
109.00 (0%) |
109.00 |
109.00 - 109.00 |
3.298 times |
Thu 15 May 2025 |
109.00 (-1%) |
112.00 |
109.00 - 112.00 |
2.0552 times |
Tue 15 April 2025 |
110.10 (1.71%) |
111.25 |
109.55 - 112.35 |
0.1637 times |
Tue 18 March 2025 |
108.25 (-0.69%) |
108.30 |
108.25 - 108.30 |
1.0307 times |
Wed 29 January 2025 |
109.00 (-1.8%) |
111.00 |
106.30 - 111.00 |
1.6773 times |
Tue 24 December 2024 |
111.00 (0.91%) |
111.00 |
111.00 - 111.00 |
0.0227 times |
Fri 18 October 2024 |
110.00 (1.48%) |
110.00 |
110.00 - 110.00 |
0.1133 times |
DMA SMA EMA moving averages of 772gs2055 800250
DMA (daily moving average) of 772gs2055 800250
| DMA period | DMA value | | 5 day DMA | 107.82 | | 12 day DMA | 107.57 | | 20 day DMA | 108.65 | | 35 day DMA | | | 50 day DMA | | | 100 day DMA | | | 150 day DMA | | | 200 day DMA | | EMA (exponential moving average) of 772gs2055 800250
| EMA period | EMA current | EMA prev | EMA prev2 | | 5 day EMA | 108.19 | 106.79 | 106.93 | | 12 day EMA | 107.94 | 107.38 | 107.54 | | 20 day EMA | 108.07 | 107.76 | 107.89 | | 35 day EMA | 0 | 0 | 0 | | 50 day EMA | 0 | 0 | 0 |
SMA (simple moving average) of 772gs2055 800250
| SMA period | SMA current | SMA prev | SMA prev2 | | 5 day SMA | 107.82 | 106.55 | 106.18 | | 12 day SMA | 107.57 | 107.42 | 107.88 | | 20 day SMA | 108.65 | 108.55 | 108.64 | | 35 day SMA | | 50 day SMA | | 100 day SMA | | 150 day SMA | | 200 day SMA |
|
|
