GoenkaDiam 533189 full analysis,charts,indicators,moving averages,SMA,DMA,EMA,ADX,MACD,RSIGoenka Diam 533189 WideScreen charts, DMA,SMA,EMA technical analysis, forecast prediction, by indicators ADX,MACD,RSI,CCI BSE stock exchange
Daily price and charts and targets GoenkaDiam Strong Daily Stock price targets for GoenkaDiam 533189 are 0.91 and 0.95 | Daily Target 1 | 0.88 | | Daily Target 2 | 0.9 | | Daily Target 3 | 0.91666666666667 | | Daily Target 4 | 0.94 | | Daily Target 5 | 0.96 |
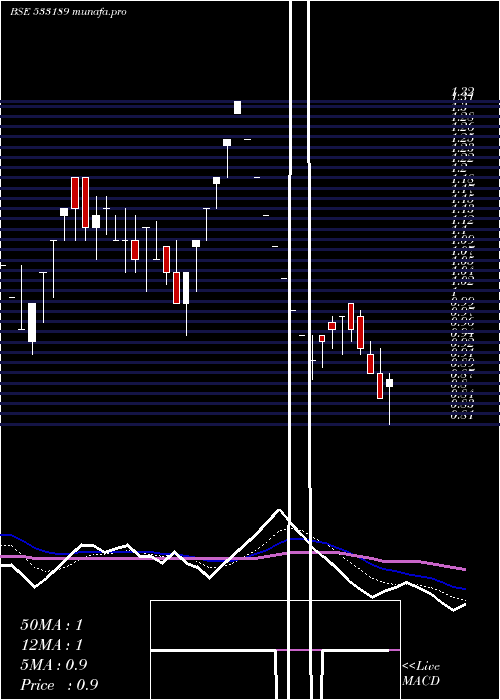
Daily price and volume Goenka Diam
| Date |
Closing |
Open |
Range |
Volume |
Fri 29 August 2025 |
0.93 (3.33%) |
0.92 |
0.89 - 0.93 |
1.3966 times |
Thu 28 August 2025 |
0.90 (0%) |
0.90 |
0.87 - 0.93 |
0.1215 times |
Tue 26 August 2025 |
0.90 (-2.17%) |
0.90 |
0.89 - 0.94 |
0.3605 times |
Mon 25 August 2025 |
0.92 (0%) |
0.92 |
0.90 - 0.96 |
1.5972 times |
Fri 22 August 2025 |
0.92 (-3.16%) |
0.92 |
0.91 - 0.93 |
0.8003 times |
Thu 21 August 2025 |
0.95 (3.26%) |
0.92 |
0.90 - 0.95 |
0.5777 times |
Wed 20 August 2025 |
0.92 (0%) |
0.92 |
0.88 - 0.95 |
1.2291 times |
Tue 19 August 2025 |
0.92 (4.55%) |
0.88 |
0.86 - 0.92 |
1.7967 times |
Mon 18 August 2025 |
0.88 (4.76%) |
0.86 |
0.82 - 0.88 |
1.0336 times |
Thu 14 August 2025 |
0.84 (0%) |
0.82 |
0.82 - 0.86 |
1.0867 times |
Wed 13 August 2025 |
0.84 (2.44%) |
0.82 |
0.81 - 0.86 |
0.6848 times |
Weekly price and charts GoenkaDiam Strong weekly Stock price targets for GoenkaDiam 533189 are 0.9 and 0.99 | Weekly Target 1 | 0.83 | | Weekly Target 2 | 0.88 | | Weekly Target 3 | 0.92 | | Weekly Target 4 | 0.97 | | Weekly Target 5 | 1.01 |
Weekly price and volumes for Goenka Diam
| Date |
Closing |
Open |
Range |
Volume |
Fri 29 August 2025 |
0.93 (1.09%) |
0.92 |
0.87 - 0.96 |
1.0394 times |
Fri 22 August 2025 |
0.92 (9.52%) |
0.86 |
0.82 - 0.95 |
1.626 times |
Thu 14 August 2025 |
0.84 (-1.18%) |
0.85 |
0.81 - 0.88 |
0.818 times |
Fri 08 August 2025 |
0.85 (3.66%) |
0.86 |
0.78 - 0.89 |
0.7295 times |
Fri 01 August 2025 |
0.82 (-8.89%) |
0.91 |
0.81 - 0.91 |
0.8024 times |
Fri 25 July 2025 |
0.90 (-2.17%) |
0.91 |
0.86 - 0.94 |
0.8122 times |
Fri 18 July 2025 |
0.92 (0%) |
0.92 |
0.88 - 0.92 |
0.9011 times |
Fri 11 July 2025 |
0.92 (0%) |
0.92 |
0.88 - 0.95 |
1.2424 times |
Fri 04 July 2025 |
0.92 (0%) |
0.90 |
0.87 - 0.95 |
1.4842 times |
Fri 27 June 2025 |
0.92 (-2.13%) |
0.91 |
0.88 - 0.95 |
0.5447 times |
Thu 19 June 2025 |
0.94 (-4.08%) |
0.97 |
0.92 - 1.00 |
0.5899 times |

Monthly price and charts GoenkaDiam Strong monthly Stock price targets for GoenkaDiam 533189 are 0.86 and 1.04 | Monthly Target 1 | 0.71 | | Monthly Target 2 | 0.82 | | Monthly Target 3 | 0.89 | | Monthly Target 4 | 1 | | Monthly Target 5 | 1.07 |
Monthly price and volumes Goenka Diam
| Date |
Closing |
Open |
Range |
Volume |
Fri 29 August 2025 |
0.93 (10.71%) |
0.84 |
0.78 - 0.96 |
0.7068 times |
Thu 31 July 2025 |
0.84 (-4.55%) |
0.88 |
0.81 - 0.95 |
0.7477 times |
Mon 30 June 2025 |
0.88 (-1.12%) |
0.85 |
0.84 - 1.03 |
0.8483 times |
Fri 30 May 2025 |
0.89 (0%) |
0.85 |
0.76 - 0.95 |
0.6136 times |
Wed 30 April 2025 |
0.89 (3.49%) |
0.82 |
0.82 - 1.02 |
0.6439 times |
Fri 28 March 2025 |
0.86 (-13.13%) |
0.99 |
0.85 - 1.03 |
1.1013 times |
Fri 28 February 2025 |
0.99 (4.21%) |
0.91 |
0.81 - 1.15 |
1.4718 times |
Mon 27 January 2025 |
0.95 (-16.67%) |
1.09 |
0.95 - 1.09 |
0.0551 times |
Mon 30 December 2024 |
1.14 (14%) |
1.00 |
0.95 - 1.32 |
0.9786 times |
Fri 29 November 2024 |
1.00 (-13.79%) |
1.11 |
0.92 - 1.20 |
2.833 times |
Mon 28 October 2024 |
1.16 (-17.73%) |
1.34 |
1.16 - 1.34 |
0.0111 times |

DMA SMA EMA moving averages of Goenka Diam 533189
DMA (daily moving average) of Goenka Diam 533189
| DMA period | DMA value | | 5 day DMA | 0.91 | | 12 day DMA | 0.9 | | 20 day DMA | 0.87 | | 35 day DMA | 0.89 | | 50 day DMA | 0.9 | | 100 day DMA | 0.9 | | 150 day DMA | 0.94 | | 200 day DMA | 0.99 | EMA (exponential moving average) of Goenka Diam 533189
| EMA period | EMA current | EMA prev | EMA prev2 | | 5 day EMA | 0.92 | 0.91 | 0.91 | | 12 day EMA | 0.9 | 0.89 | 0.89 | | 20 day EMA | 0.88 | 0.88 | 0.88 | | 35 day EMA | 0.9 | 0.9 | 0.9 | | 50 day EMA | 0.9 | 0.9 | 0.9 |
SMA (simple moving average) of Goenka Diam 533189
| SMA period | SMA current | SMA prev | SMA prev2 | | 5 day SMA | 0.91 | 0.92 | 0.92 | | 12 day SMA | 0.9 | 0.89 | 0.88 | | 20 day SMA | 0.87 | 0.87 | 0.87 | | 35 day SMA | 0.89 | 0.89 | 0.89 | | 50 day SMA | 0.9 | 0.9 | 0.9 | | 100 day SMA | 0.9 | 0.9 | 0.9 | | 150 day SMA | 0.94 | 0.94 | 0.94 | | 200 day SMA | 0.99 | 0.99 | 0.99 |
|
|
