RichaInd 532766 full analysis,charts,indicators,moving averages,SMA,DMA,EMA,ADX,MACD,RSIRicha Ind 532766 WideScreen charts, DMA,SMA,EMA technical analysis, forecast prediction, by indicators ADX,MACD,RSI,CCI BSE stock exchange
Daily price and charts and targets RichaInd Strong Daily Stock price targets for RichaInd 532766 are 1.62 and 1.78 | Daily Target 1 | 1.49 | | Daily Target 2 | 1.59 | | Daily Target 3 | 1.6466666666667 | | Daily Target 4 | 1.75 | | Daily Target 5 | 1.81 |
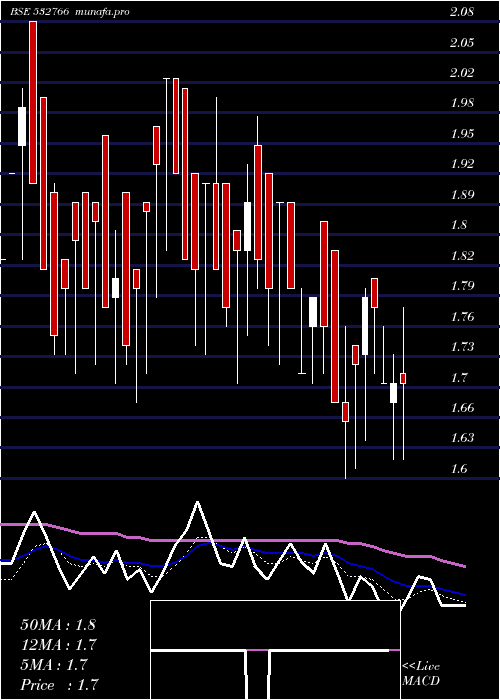
Daily price and volume Richa Ind
| Date |
Closing |
Open |
Range |
Volume |
Fri 31 October 2025 |
1.70 (4.94%) |
1.62 |
1.54 - 1.70 |
0.4337 times |
Thu 30 October 2025 |
1.62 (3.18%) |
1.64 |
1.50 - 1.64 |
0.1758 times |
Wed 29 October 2025 |
1.57 (-4.85%) |
1.63 |
1.57 - 1.63 |
0.6789 times |
Tue 28 October 2025 |
1.65 (4.43%) |
1.65 |
1.55 - 1.65 |
2.6729 times |
Mon 27 October 2025 |
1.58 (-4.24%) |
1.71 |
1.58 - 1.74 |
0.1392 times |
Thu 23 October 2025 |
1.65 (-4.62%) |
1.81 |
1.65 - 1.81 |
0.8585 times |
Tue 21 October 2025 |
1.73 (4.85%) |
1.73 |
1.73 - 1.73 |
0.5686 times |
Mon 20 October 2025 |
1.65 (-1.79%) |
1.76 |
1.60 - 1.76 |
1.8781 times |
Fri 17 October 2025 |
1.68 (5%) |
1.68 |
1.52 - 1.68 |
2.4423 times |
Thu 16 October 2025 |
1.60 (2.56%) |
1.52 |
1.49 - 1.60 |
0.1519 times |
Wed 15 October 2025 |
1.56 (4.7%) |
1.42 |
1.42 - 1.56 |
1.1675 times |
Weekly price and charts RichaInd Strong weekly Stock price targets for RichaInd 532766 are 1.48 and 1.72 | Weekly Target 1 | 1.41 | | Weekly Target 2 | 1.55 | | Weekly Target 3 | 1.6466666666667 | | Weekly Target 4 | 1.79 | | Weekly Target 5 | 1.89 |
Weekly price and volumes for Richa Ind
| Date |
Closing |
Open |
Range |
Volume |
Fri 31 October 2025 |
1.70 (3.03%) |
1.71 |
1.50 - 1.74 |
0.8291 times |
Thu 23 October 2025 |
1.65 (-1.79%) |
1.76 |
1.60 - 1.81 |
0.6683 times |
Fri 17 October 2025 |
1.68 (8.39%) |
1.55 |
1.42 - 1.68 |
1.0788 times |
Fri 10 October 2025 |
1.55 (-9.88%) |
1.80 |
1.55 - 1.80 |
0.3202 times |
Fri 03 October 2025 |
1.72 (4.88%) |
1.65 |
1.50 - 1.72 |
1.8858 times |
Fri 26 September 2025 |
1.64 (6.49%) |
1.54 |
1.47 - 1.71 |
1.123 times |
Fri 19 September 2025 |
1.54 (-3.75%) |
1.66 |
1.40 - 1.73 |
1.2987 times |
Fri 12 September 2025 |
1.60 (3.23%) |
1.60 |
1.48 - 1.69 |
1.9374 times |
Fri 05 September 2025 |
1.55 (-4.32%) |
1.57 |
1.48 - 1.70 |
0.3345 times |
Fri 29 August 2025 |
1.62 (-5.81%) |
1.70 |
1.56 - 1.75 |
0.524 times |
Fri 22 August 2025 |
1.72 (0.58%) |
1.72 |
1.57 - 1.78 |
1.0432 times |

Monthly price and charts RichaInd Strong monthly Stock price targets for RichaInd 532766 are 1.56 and 1.95 | Monthly Target 1 | 1.25 | | Monthly Target 2 | 1.48 | | Monthly Target 3 | 1.6433333333333 | | Monthly Target 4 | 1.87 | | Monthly Target 5 | 2.03 |
Monthly price and volumes Richa Ind
| Date |
Closing |
Open |
Range |
Volume |
Fri 31 October 2025 |
1.70 (8.28%) |
1.55 |
1.42 - 1.81 |
1.0565 times |
Tue 30 September 2025 |
1.57 (-3.09%) |
1.57 |
1.40 - 1.73 |
1.314 times |
Fri 29 August 2025 |
1.62 (2.53%) |
1.51 |
1.51 - 1.79 |
0.5231 times |
Thu 31 July 2025 |
1.58 (-7.06%) |
1.74 |
1.47 - 1.95 |
2.9517 times |
Mon 30 June 2025 |
1.70 (5.59%) |
1.61 |
1.47 - 1.77 |
0.7631 times |
Fri 30 May 2025 |
1.61 (-3.01%) |
1.72 |
1.52 - 1.78 |
0.4091 times |
Wed 30 April 2025 |
1.66 (18.57%) |
1.38 |
1.35 - 1.80 |
0.7938 times |
Fri 28 March 2025 |
1.40 (-4.76%) |
1.48 |
1.28 - 1.56 |
0.5991 times |
Fri 28 February 2025 |
1.47 (-20.11%) |
1.86 |
1.44 - 1.89 |
0.5831 times |
Fri 31 January 2025 |
1.84 (12.88%) |
1.71 |
1.52 - 1.86 |
1.0063 times |
Tue 31 December 2024 |
1.63 (-10.44%) |
1.91 |
1.60 - 2.00 |
2.2962 times |

DMA SMA EMA moving averages of Richa Ind 532766
DMA (daily moving average) of Richa Ind 532766
| DMA period | DMA value | | 5 day DMA | 1.62 | | 12 day DMA | 1.62 | | 20 day DMA | 1.64 | | 35 day DMA | 1.62 | | 50 day DMA | 1.62 | | 100 day DMA | 1.65 | | 150 day DMA | 1.62 | | 200 day DMA | 1.63 | EMA (exponential moving average) of Richa Ind 532766
| EMA period | EMA current | EMA prev | EMA prev2 | | 5 day EMA | 1.65 | 1.62 | 1.62 | | 12 day EMA | 1.63 | 1.62 | 1.62 | | 20 day EMA | 1.63 | 1.62 | 1.62 | | 35 day EMA | 1.64 | 1.64 | 1.64 | | 50 day EMA | 1.63 | 1.63 | 1.63 |
SMA (simple moving average) of Richa Ind 532766
| SMA period | SMA current | SMA prev | SMA prev2 | | 5 day SMA | 1.62 | 1.61 | 1.64 | | 12 day SMA | 1.62 | 1.61 | 1.61 | | 20 day SMA | 1.64 | 1.63 | 1.63 | | 35 day SMA | 1.62 | 1.62 | 1.62 | | 50 day SMA | 1.62 | 1.62 | 1.63 | | 100 day SMA | 1.65 | 1.65 | 1.65 | | 150 day SMA | 1.62 | 1.62 | 1.62 | | 200 day SMA | 1.63 | 1.63 | 1.63 |
|
|
