EuroAsia 530929 full analysis,charts,indicators,moving averages,SMA,DMA,EMA,ADX,MACD,RSIEuro Asia 530929 WideScreen charts, DMA,SMA,EMA technical analysis, forecast prediction, by indicators ADX,MACD,RSI,CCI BSE stock exchange
Daily price and charts and targets EuroAsia Strong Daily Stock price targets for EuroAsia 530929 are 909.5 and 909.5 | Daily Target 1 | 909.5 | | Daily Target 2 | 909.5 | | Daily Target 3 | 909.5 | | Daily Target 4 | 909.5 | | Daily Target 5 | 909.5 |
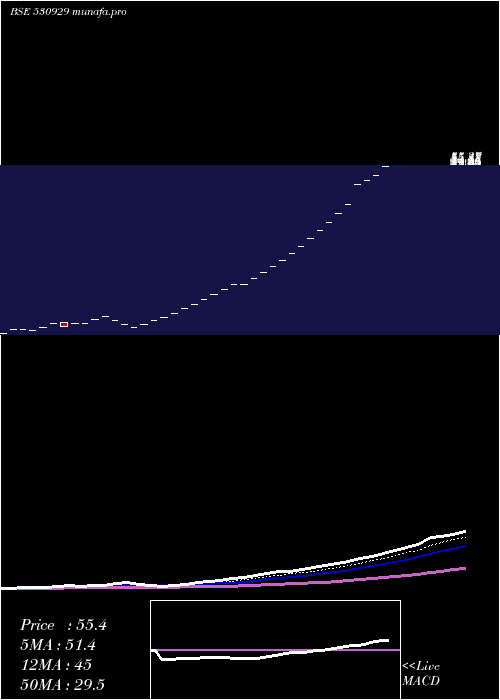
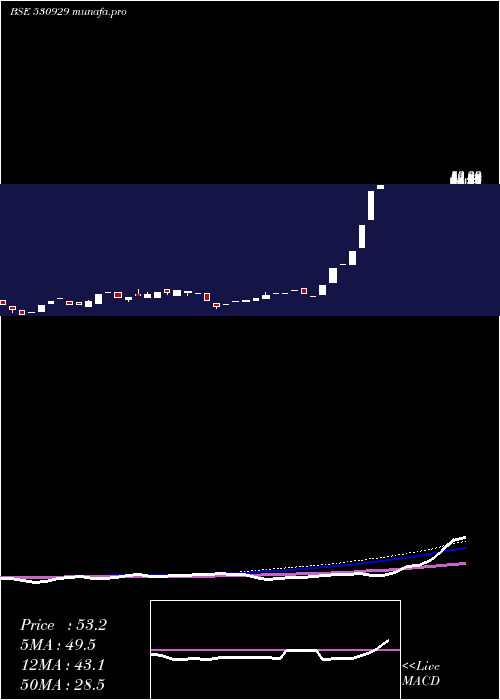
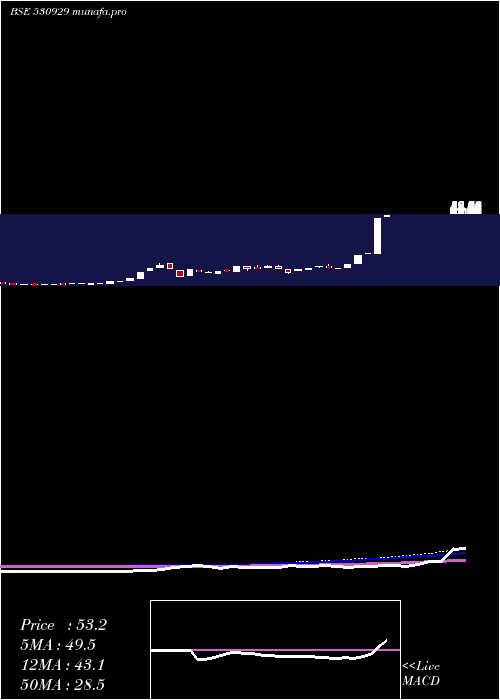
Daily price and volume Euro Asia
| Date |
Closing |
Open |
Range |
Volume |
Fri 31 October 2025 |
909.50 (2%) |
909.50 |
909.50 - 909.50 |
1.0233 times |
Thu 30 October 2025 |
891.70 (2%) |
891.70 |
891.70 - 891.70 |
5.1381 times |
Wed 29 October 2025 |
874.25 (1.99%) |
874.25 |
874.25 - 874.25 |
0.3814 times |
Tue 28 October 2025 |
857.15 (2%) |
857.15 |
857.15 - 857.15 |
0.3683 times |
Mon 27 October 2025 |
840.35 (4.04%) |
840.35 |
840.35 - 840.35 |
0.1364 times |
Thu 23 October 2025 |
807.75 (2%) |
807.75 |
807.75 - 807.75 |
0.6193 times |
Tue 21 October 2025 |
791.95 (2%) |
791.95 |
791.95 - 791.95 |
0.097 times |
Mon 20 October 2025 |
776.45 (2%) |
776.45 |
776.45 - 776.45 |
0.4114 times |
Fri 17 October 2025 |
761.25 (2%) |
761.25 |
761.25 - 761.25 |
0.0937 times |
Thu 16 October 2025 |
746.35 (2%) |
746.35 |
746.35 - 746.35 |
1.731 times |
Wed 15 October 2025 |
731.75 (1.99%) |
731.75 |
731.75 - 731.75 |
4.6971 times |
Weekly price and charts EuroAsia Strong weekly Stock price targets for EuroAsia 530929 are 874.93 and 944.08 | Weekly Target 1 | 817.3 | | Weekly Target 2 | 863.4 | | Weekly Target 3 | 886.45 | | Weekly Target 4 | 932.55 | | Weekly Target 5 | 955.6 |
Weekly price and volumes for Euro Asia
| Date |
Closing |
Open |
Range |
Volume |
Fri 31 October 2025 |
909.50 (12.6%) |
840.35 |
840.35 - 909.50 |
2.2694 times |
Thu 23 October 2025 |
807.75 (6.11%) |
776.45 |
776.45 - 807.75 |
0.3632 times |
Fri 17 October 2025 |
761.25 (10.38%) |
703.35 |
703.35 - 761.25 |
4.9117 times |
Fri 10 October 2025 |
689.65 (10.38%) |
637.25 |
637.25 - 689.65 |
0.3844 times |
Fri 03 October 2025 |
624.80 (8.23%) |
588.80 |
588.80 - 624.80 |
0.2871 times |
Fri 26 September 2025 |
577.30 (10.38%) |
533.45 |
533.45 - 577.30 |
0.9276 times |
Fri 19 September 2025 |
523.00 (10.4%) |
483.20 |
483.20 - 523.00 |
0.21 times |
Fri 12 September 2025 |
473.75 (10.38%) |
437.75 |
437.75 - 473.75 |
0.0339 times |
Fri 05 September 2025 |
429.20 (10.38%) |
396.60 |
396.60 - 429.20 |
0.5128 times |
Fri 29 August 2025 |
388.85 (8.21%) |
366.50 |
366.50 - 388.85 |
0.0999 times |
Fri 22 August 2025 |
359.35 (10.37%) |
332.10 |
332.10 - 359.35 |
0.0893 times |
Monthly price and charts EuroAsia Strong monthly Stock price targets for EuroAsia 530929 are 761.03 and 1057.98 | Monthly Target 1 | 513.57 | | Monthly Target 2 | 711.53 | | Monthly Target 3 | 810.51666666667 | | Monthly Target 4 | 1008.48 | | Monthly Target 5 | 1107.47 |
Monthly price and volumes Euro Asia
| Date |
Closing |
Open |
Range |
Volume |
Fri 31 October 2025 |
909.50 (51.44%) |
612.55 |
612.55 - 909.50 |
6.8552 times |
Tue 30 September 2025 |
600.55 (54.44%) |
396.60 |
396.60 - 600.55 |
1.5345 times |
Fri 29 August 2025 |
388.85 (45.47%) |
272.60 |
272.60 - 388.85 |
0.3735 times |
Thu 31 July 2025 |
267.30 (57.28%) |
173.30 |
173.30 - 267.30 |
0.2948 times |
Mon 30 June 2025 |
169.95 (50.84%) |
114.90 |
114.90 - 169.95 |
0.0674 times |
Fri 30 May 2025 |
112.67 (51.38%) |
75.91 |
75.91 - 112.67 |
0.2288 times |
Wed 30 April 2025 |
74.43 (45.46%) |
52.19 |
52.19 - 74.43 |
0.1632 times |
Fri 28 March 2025 |
51.17 (88.26%) |
27.18 |
27.18 - 51.17 |
0.0871 times |
Mon 03 February 2025 |
27.18 (4.98%) |
27.18 |
27.18 - 27.18 |
0.0036 times |
Fri 31 January 2025 |
25.89 (33.8%) |
20.31 |
20.31 - 25.89 |
0.3918 times |
Thu 19 December 2024 |
19.35 (15.66%) |
17.56 |
17.56 - 19.35 |
0.0544 times |
DMA SMA EMA moving averages of Euro Asia 530929
DMA (daily moving average) of Euro Asia 530929
| DMA period | DMA value | | 5 day DMA | 874.59 | | 12 day DMA | 808.83 | | 20 day DMA | 748.13 | | 35 day DMA | 652.45 | | 50 day DMA | 573.8 | | 100 day DMA | 393.29 | | 150 day DMA | 287.58 | | 200 day DMA | 220.35 | EMA (exponential moving average) of Euro Asia 530929
| EMA period | EMA current | EMA prev | EMA prev2 | | 5 day EMA | 873.18 | 855.03 | 836.7 | | 12 day EMA | 814.76 | 797.54 | 780.43 | | 20 day EMA | 758.49 | 742.6 | 726.91 | | 35 day EMA | 669.38 | 655.24 | 641.32 | | 50 day EMA | 583.11 | 569.79 | 556.66 |
SMA (simple moving average) of Euro Asia 530929
| SMA period | SMA current | SMA prev | SMA prev2 | | 5 day SMA | 874.59 | 854.24 | 834.29 | | 12 day SMA | 808.83 | 791.65 | 774.81 | | 20 day SMA | 748.13 | 732.68 | 717.54 | | 35 day SMA | 652.45 | 639.22 | 626.25 | | 50 day SMA | 573.8 | 562.25 | 550.93 | | 100 day SMA | 393.29 | 385.41 | 377.69 | | 150 day SMA | 287.58 | 281.73 | 275.98 | | 200 day SMA | 220.35 | 215.9 | 211.53 |
|
|
