NeogemIndia 526195 full analysis,charts,indicators,moving averages,SMA,DMA,EMA,ADX,MACD,RSINeogem India 526195 WideScreen charts, DMA,SMA,EMA technical analysis, forecast prediction, by indicators ADX,MACD,RSI,CCI BSE stock exchange
Daily price and charts and targets NeogemIndia Strong Daily Stock price targets for NeogemIndia 526195 are 3.45 and 3.82 | Daily Target 1 | 3.38 | | Daily Target 2 | 3.51 | | Daily Target 3 | 3.7533333333333 | | Daily Target 4 | 3.88 | | Daily Target 5 | 4.12 |
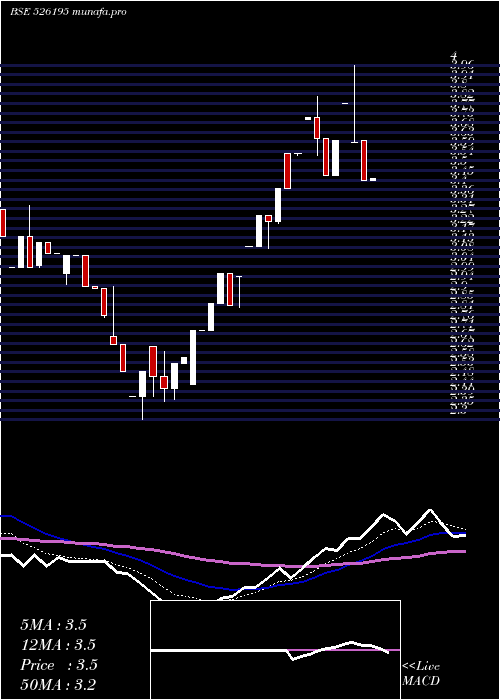
Daily price and volume Neogem India
| Date |
Closing |
Open |
Range |
Volume |
Mon 03 February 2025 |
3.63 (-4.97%) |
3.63 |
3.63 - 4.00 |
1.1976 times |
Mon 27 January 2025 |
3.82 (4.95%) |
3.82 |
3.82 - 3.82 |
0.2004 times |
Mon 20 January 2025 |
3.64 (4.9%) |
3.47 |
3.47 - 3.64 |
1.2065 times |
Mon 13 January 2025 |
3.47 (-4.93%) |
3.65 |
3.47 - 3.65 |
0.3513 times |
Mon 06 January 2025 |
3.65 (-2.67%) |
3.75 |
3.57 - 3.85 |
0.5951 times |
Mon 30 December 2024 |
3.75 (4.75%) |
3.74 |
3.74 - 3.75 |
0.4189 times |
Mon 23 December 2024 |
3.58 (4.99%) |
3.58 |
3.57 - 3.58 |
3.3148 times |
Mon 16 December 2024 |
3.41 (0%) |
3.58 |
3.41 - 3.58 |
0.7524 times |
Mon 09 December 2024 |
3.41 (4.92%) |
3.25 |
3.24 - 3.41 |
1.2851 times |
Mon 02 December 2024 |
3.25 (-0.91%) |
3.28 |
3.12 - 3.28 |
0.6778 times |
Mon 25 November 2024 |
3.28 (4.79%) |
3.13 |
3.13 - 3.28 |
1.2696 times |
Weekly price and charts NeogemIndia Strong weekly Stock price targets for NeogemIndia 526195 are 3.45 and 3.82 | Weekly Target 1 | 3.38 | | Weekly Target 2 | 3.51 | | Weekly Target 3 | 3.7533333333333 | | Weekly Target 4 | 3.88 | | Weekly Target 5 | 4.12 |
Weekly price and volumes for Neogem India
| Date |
Closing |
Open |
Range |
Volume |
Mon 03 February 2025 |
3.63 (-4.97%) |
3.63 |
3.63 - 4.00 |
1.1976 times |
Mon 27 January 2025 |
3.82 (4.95%) |
3.82 |
3.82 - 3.82 |
0.2004 times |
Mon 20 January 2025 |
3.64 (4.9%) |
3.47 |
3.47 - 3.64 |
1.2065 times |
Mon 13 January 2025 |
3.47 (-4.93%) |
3.65 |
3.47 - 3.65 |
0.3513 times |
Mon 06 January 2025 |
3.65 (-2.67%) |
3.75 |
3.57 - 3.85 |
0.5951 times |
Mon 30 December 2024 |
3.75 (4.75%) |
3.74 |
3.74 - 3.75 |
0.4189 times |
Mon 23 December 2024 |
3.58 (4.99%) |
3.58 |
3.57 - 3.58 |
3.3148 times |
Mon 16 December 2024 |
3.41 (0%) |
3.58 |
3.41 - 3.58 |
0.7524 times |
Mon 09 December 2024 |
3.41 (4.92%) |
3.25 |
3.24 - 3.41 |
1.2851 times |
Mon 02 December 2024 |
3.25 (-0.91%) |
3.28 |
3.12 - 3.28 |
0.6778 times |
Mon 25 November 2024 |
3.28 (4.79%) |
3.13 |
3.13 - 3.28 |
1.2696 times |

Monthly price and charts NeogemIndia Strong monthly Stock price targets for NeogemIndia 526195 are 3.45 and 3.82 | Monthly Target 1 | 3.38 | | Monthly Target 2 | 3.51 | | Monthly Target 3 | 3.7533333333333 | | Monthly Target 4 | 3.88 | | Monthly Target 5 | 4.12 |
Monthly price and volumes Neogem India
| Date |
Closing |
Open |
Range |
Volume |
Mon 03 February 2025 |
3.63 (-4.97%) |
3.63 |
3.63 - 4.00 |
0.3114 times |
Mon 27 January 2025 |
3.82 (1.87%) |
3.75 |
3.47 - 3.85 |
0.612 times |
Mon 30 December 2024 |
3.75 (14.33%) |
3.28 |
3.12 - 3.75 |
1.6771 times |
Mon 25 November 2024 |
3.28 (9.33%) |
3.00 |
2.84 - 3.28 |
1.0717 times |
Mon 28 October 2024 |
3.00 (9.89%) |
2.73 |
2.73 - 3.00 |
0.3199 times |
Mon 30 September 2024 |
2.73 (7.91%) |
2.65 |
2.39 - 2.73 |
3.2354 times |
Mon 26 August 2024 |
2.53 (-9.64%) |
2.70 |
2.30 - 2.94 |
1.4076 times |
Mon 29 July 2024 |
2.80 (-9.68%) |
3.00 |
2.79 - 3.09 |
0.9879 times |
Tue 18 June 2024 |
3.10 (2.31%) |
3.04 |
3.03 - 3.15 |
0.113 times |
Mon 27 May 2024 |
3.03 (-8.46%) |
3.31 |
3.03 - 3.33 |
0.264 times |
Mon 29 April 2024 |
3.31 (-21.93%) |
4.03 |
3.29 - 4.03 |
1.2079 times |

DMA SMA EMA moving averages of Neogem India 526195
DMA (daily moving average) of Neogem India 526195
| DMA period | DMA value | | 5 day DMA | 3.64 | | 12 day DMA | 3.5 | | 20 day DMA | 3.22 | | 35 day DMA | 3.05 | | 50 day DMA | 3.31 | | 100 day DMA | 3 | | 150 day DMA | 3.17 | | 200 day DMA | 3.6 | EMA (exponential moving average) of Neogem India 526195
| EMA period | EMA current | EMA prev | EMA prev2 | | 5 day EMA | 3.64 | 3.65 | 3.56 | | 12 day EMA | 3.49 | 3.46 | 3.39 | | 20 day EMA | 3.36 | 3.33 | 3.28 | | 35 day EMA | 3.38 | 3.36 | 3.33 | | 50 day EMA | 3.39 | 3.38 | 3.36 |
SMA (simple moving average) of Neogem India 526195
| SMA period | SMA current | SMA prev | SMA prev2 | | 5 day SMA | 3.64 | 3.67 | 3.62 | | 12 day SMA | 3.5 | 3.45 | 3.37 | | 20 day SMA | 3.22 | 3.16 | 3.09 | | 35 day SMA | 3.05 | 3.03 | 3.01 | | 50 day SMA | 3.31 | 3.32 | 3.33 | | 100 day SMA | 3 | 3 | 2.99 | | 150 day SMA | 3.17 | 3.17 | 3.18 | | 200 day SMA | 3.6 | 3.61 | 3.62 |
|
|
