DugarHou 511634 full analysis,charts,indicators,moving averages,SMA,DMA,EMA,ADX,MACD,RSIDugar Hou 511634 WideScreen charts, DMA,SMA,EMA technical analysis, forecast prediction, by indicators ADX,MACD,RSI,CCI BSE stock exchange
Daily price and charts and targets DugarHou Strong Daily Stock price targets for DugarHou 511634 are 368.1 and 368.3 | Daily Target 1 | 367.93 | | Daily Target 2 | 368.07 | | Daily Target 3 | 368.13333333333 | | Daily Target 4 | 368.27 | | Daily Target 5 | 368.33 |
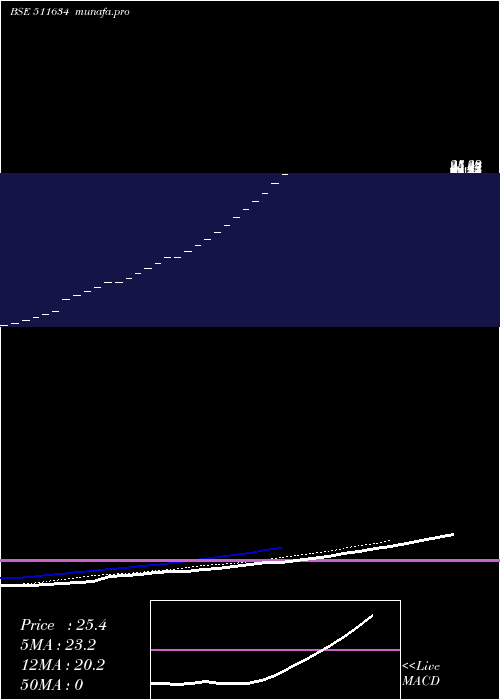
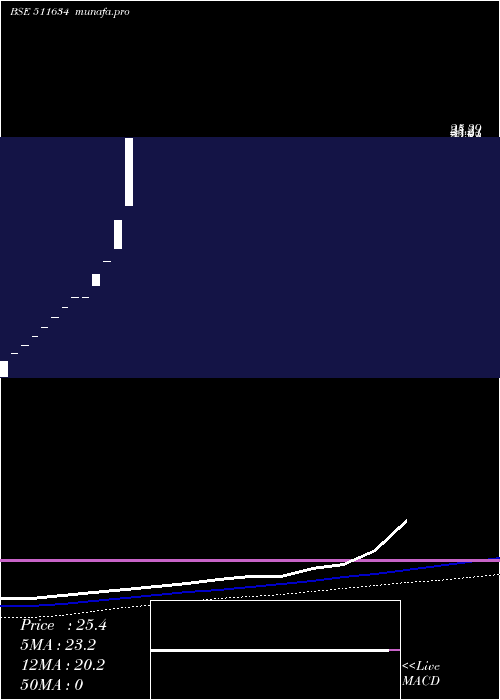
Daily price and volume Dugar Hou
| Date |
Closing |
Open |
Range |
Volume |
Mon 22 December 2025 |
368.20 (0.99%) |
368.20 |
368.00 - 368.20 |
0.0678 times |
Mon 15 December 2025 |
364.60 (1%) |
364.60 |
364.60 - 364.60 |
0.8628 times |
Mon 08 December 2025 |
361.00 (0.98%) |
361.05 |
361.00 - 361.05 |
0.7642 times |
Mon 01 December 2025 |
357.50 (0.99%) |
357.50 |
357.50 - 357.50 |
0.2034 times |
Mon 24 November 2025 |
354.00 (1%) |
354.00 |
354.00 - 354.00 |
0.3492 times |
Mon 17 November 2025 |
350.50 (0.99%) |
347.05 |
343.60 - 350.50 |
0.6532 times |
Mon 10 November 2025 |
347.05 (0.99%) |
347.05 |
347.05 - 347.05 |
3.1491 times |
Fri 07 November 2025 |
343.65 (1.97%) |
343.70 |
343.65 - 343.70 |
3.8989 times |
Thu 06 November 2025 |
337.00 (2%) |
337.00 |
337.00 - 337.00 |
0.0205 times |
Tue 04 November 2025 |
330.40 (1.99%) |
330.40 |
330.40 - 330.40 |
0.0308 times |
Mon 03 November 2025 |
323.95 (2%) |
323.95 |
323.95 - 323.95 |
0.0205 times |
Weekly price and charts DugarHou Strong weekly Stock price targets for DugarHou 511634 are 368.1 and 368.3 | Weekly Target 1 | 367.93 | | Weekly Target 2 | 368.07 | | Weekly Target 3 | 368.13333333333 | | Weekly Target 4 | 368.27 | | Weekly Target 5 | 368.33 |
Weekly price and volumes for Dugar Hou
| Date |
Closing |
Open |
Range |
Volume |
Mon 22 December 2025 |
368.20 (0.99%) |
368.20 |
368.00 - 368.20 |
0.0649 times |
Mon 15 December 2025 |
364.60 (1%) |
364.60 |
364.60 - 364.60 |
0.8261 times |
Mon 08 December 2025 |
361.00 (0.98%) |
361.05 |
361.00 - 361.05 |
0.7317 times |
Mon 01 December 2025 |
357.50 (0.99%) |
357.50 |
357.50 - 357.50 |
0.1947 times |
Mon 24 November 2025 |
354.00 (1%) |
354.00 |
354.00 - 354.00 |
0.3344 times |
Mon 17 November 2025 |
350.50 (0.99%) |
347.05 |
343.60 - 350.50 |
0.6255 times |
Mon 10 November 2025 |
347.05 (0.99%) |
347.05 |
347.05 - 347.05 |
3.0153 times |
Fri 07 November 2025 |
343.65 (8.2%) |
323.95 |
323.95 - 343.70 |
3.8021 times |
Fri 31 October 2025 |
317.60 (12.56%) |
293.50 |
293.50 - 317.60 |
0.3265 times |
Thu 23 October 2025 |
282.15 (4.02%) |
276.65 |
276.65 - 282.15 |
0.0787 times |
Fri 17 October 2025 |
271.25 (10.38%) |
250.65 |
250.65 - 271.25 |
0.3659 times |
Monthly price and charts DugarHou Strong monthly Stock price targets for DugarHou 511634 are 362.85 and 373.55 | Monthly Target 1 | 353.93 | | Monthly Target 2 | 361.07 | | Monthly Target 3 | 364.63333333333 | | Monthly Target 4 | 371.77 | | Monthly Target 5 | 375.33 |
Monthly price and volumes Dugar Hou
| Date |
Closing |
Open |
Range |
Volume |
Mon 22 December 2025 |
368.20 (4.01%) |
357.50 |
357.50 - 368.20 |
0.9984 times |
Mon 24 November 2025 |
354.00 (11.46%) |
323.95 |
323.95 - 354.00 |
4.2723 times |
Fri 31 October 2025 |
317.60 (48.34%) |
218.35 |
218.35 - 317.60 |
0.7952 times |
Tue 30 September 2025 |
214.10 (54.07%) |
141.70 |
141.70 - 214.10 |
1.8055 times |
Fri 29 August 2025 |
138.96 (45.54%) |
97.38 |
97.38 - 138.96 |
0.4689 times |
Thu 31 July 2025 |
95.48 (57.45%) |
61.85 |
61.85 - 95.48 |
0.5727 times |
Mon 30 June 2025 |
60.64 (51.22%) |
40.90 |
40.90 - 60.64 |
0.3793 times |
Fri 30 May 2025 |
40.10 (132.87%) |
18.08 |
18.08 - 40.10 |
0.5348 times |
Wed 19 March 2025 |
17.22 (5%) |
17.22 |
17.22 - 17.22 |
0.054 times |
Fri 31 January 2025 |
16.40 (10.22%) |
15.62 |
15.62 - 16.40 |
0.1189 times |
Mon 23 September 2024 |
14.88 (10.14%) |
14.18 |
14.18 - 14.88 |
0.1189 times |

DMA SMA EMA moving averages of Dugar Hou 511634
DMA (daily moving average) of Dugar Hou 511634
| DMA period | DMA value | | 5 day DMA | 361.06 | | 12 day DMA | 346.29 | | 20 day DMA | 323.05 | | 35 day DMA | 282.3 | | 50 day DMA | 248.52 | | 100 day DMA | 170.64 | | 150 day DMA | 122.95 | | 200 day DMA | | EMA (exponential moving average) of Dugar Hou 511634
| EMA period | EMA current | EMA prev | EMA prev2 | | 5 day EMA | 360.75 | 357.02 | 353.23 | | 12 day EMA | 344.12 | 339.74 | 335.22 | | 20 day EMA | 323.66 | 318.97 | 314.17 | | 35 day EMA | 287.71 | 282.97 | 278.16 | | 50 day EMA | 250.79 | 246 | 241.16 |
SMA (simple moving average) of Dugar Hou 511634
| SMA period | SMA current | SMA prev | SMA prev2 | | 5 day SMA | 361.06 | 357.52 | 354.01 | | 12 day SMA | 346.29 | 341.55 | 336.61 | | 20 day SMA | 323.05 | 317.68 | 312.23 | | 35 day SMA | 282.3 | 277.32 | 272.34 | | 50 day SMA | 248.52 | 244.04 | 239.59 | | 100 day SMA | 170.64 | 167.49 | 164.36 | | 150 day SMA | 122.95 | 120.54 | | 200 day SMA |
|
|
