PacerBiothreat VIRS full analysis,charts,indicators,moving averages,SMA,DMA,EMA,ADX,MACD,RSIPacer Biothreat VIRS WideScreen charts, DMA,SMA,EMA technical analysis, forecast prediction, by indicators ADX,MACD,RSI,CCI AMEX stock exchange
Daily price and charts and targets PacerBiothreat Strong Daily Stock price targets for PacerBiothreat VIRS are 36.05 and 36.05 | Daily Target 1 | 36.05 | | Daily Target 2 | 36.05 | | Daily Target 3 | 36.05 | | Daily Target 4 | 36.05 | | Daily Target 5 | 36.05 |
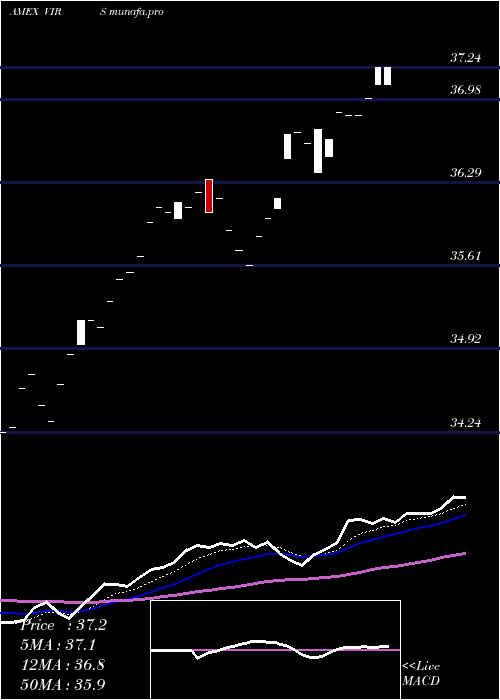
Daily price and volume Pacer Biothreat
| Date |
Closing |
Open |
Range |
Volume |
Fri 17 May 2024 |
36.05 (-0.11%) |
36.05 |
36.05 - 36.05 |
0.6207 times |
Thu 16 May 2024 |
36.09 (0.33%) |
36.09 |
36.09 - 36.09 |
0.0255 times |
Wed 15 May 2024 |
35.97 (0.78%) |
35.97 |
35.97 - 35.97 |
0 times |
Tue 14 May 2024 |
35.69 (0.39%) |
35.69 |
35.69 - 35.69 |
0.8503 times |
Mon 13 May 2024 |
35.55 (0.14%) |
35.55 |
35.55 - 35.55 |
4.2517 times |
Fri 10 May 2024 |
35.50 (0.51%) |
35.50 |
35.50 - 35.50 |
0.8503 times |
Thu 09 May 2024 |
35.32 (0.63%) |
35.32 |
35.32 - 35.32 |
0 times |
Wed 08 May 2024 |
35.10 (-0.17%) |
35.10 |
35.10 - 35.10 |
0.8503 times |
Tue 07 May 2024 |
35.16 (0%) |
35.16 |
35.16 - 35.16 |
0.8503 times |
Mon 06 May 2024 |
35.16 (0.8%) |
34.96 |
34.96 - 35.16 |
1.7007 times |
Fri 03 May 2024 |
34.88 (0.72%) |
34.88 |
34.88 - 34.88 |
0.8503 times |
Weekly price and charts PacerBiothreat Strong weekly Stock price targets for PacerBiothreat VIRS are 35.8 and 36.34 | Weekly Target 1 | 35.36 | | Weekly Target 2 | 35.7 | | Weekly Target 3 | 35.896666666667 | | Weekly Target 4 | 36.24 | | Weekly Target 5 | 36.44 |
Weekly price and volumes for Pacer Biothreat
| Date |
Closing |
Open |
Range |
Volume |
Fri 17 May 2024 |
36.05 (1.55%) |
35.55 |
35.55 - 36.09 |
0.942 times |
Fri 10 May 2024 |
35.50 (1.78%) |
34.96 |
34.96 - 35.50 |
0.6968 times |
Fri 03 May 2024 |
34.88 (0.81%) |
34.71 |
34.33 - 34.88 |
0.6968 times |
Fri 26 April 2024 |
34.60 (2.95%) |
33.96 |
33.96 - 34.60 |
0.5574 times |
Fri 19 April 2024 |
33.61 (-3%) |
34.30 |
33.61 - 34.42 |
0.9755 times |
Fri 12 April 2024 |
34.65 (-2.12%) |
35.30 |
34.65 - 35.42 |
1.8116 times |
Fri 05 April 2024 |
35.40 (-2.21%) |
35.95 |
35.08 - 35.97 |
1.6722 times |
Thu 28 March 2024 |
36.20 (-0.08%) |
36.12 |
36.05 - 36.26 |
0.5574 times |
Fri 22 March 2024 |
36.23 (1.6%) |
35.67 |
35.67 - 36.23 |
0.9755 times |
Fri 15 March 2024 |
35.66 (-0.67%) |
35.83 |
35.66 - 36.20 |
1.1148 times |
Fri 08 March 2024 |
35.90 (1.04%) |
35.52 |
35.41 - 36.10 |
0.6968 times |
Monthly price and charts PacerBiothreat Strong monthly Stock price targets for PacerBiothreat VIRS are 35.19 and 36.95 | Monthly Target 1 | 33.73 | | Monthly Target 2 | 34.89 | | Monthly Target 3 | 35.49 | | Monthly Target 4 | 36.65 | | Monthly Target 5 | 37.25 |
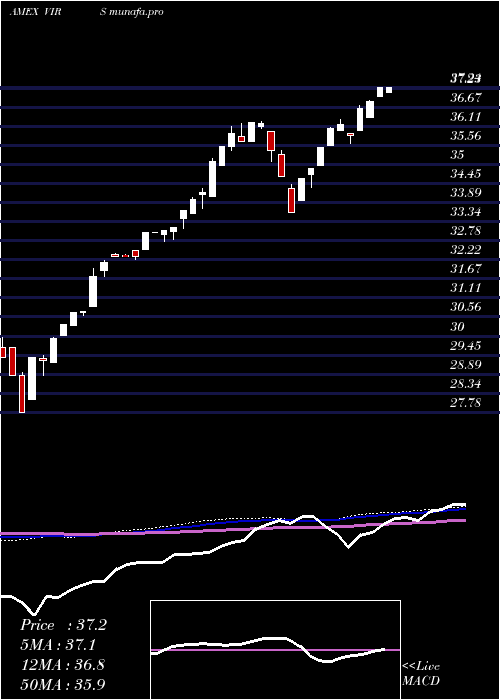
Monthly price and volumes Pacer Biothreat
| Date |
Closing |
Open |
Range |
Volume |
Fri 17 May 2024 |
36.05 (4.61%) |
34.33 |
34.33 - 36.09 |
0.3898 times |
Tue 30 April 2024 |
34.46 (-4.81%) |
35.95 |
33.61 - 35.97 |
1.0037 times |
Thu 28 March 2024 |
36.20 (2.58%) |
35.53 |
35.41 - 36.26 |
0.6603 times |
Thu 29 February 2024 |
35.29 (6.52%) |
33.56 |
33.56 - 35.29 |
0.6075 times |
Wed 31 January 2024 |
33.13 (2.51%) |
32.49 |
32.23 - 33.51 |
0.7131 times |
Fri 29 December 2023 |
32.32 (6.07%) |
30.69 |
30.60 - 32.41 |
2.0866 times |
Thu 30 November 2023 |
30.47 (7.1%) |
28.56 |
28.56 - 30.47 |
1.2607 times |
Tue 31 October 2023 |
28.45 (-4.59%) |
29.69 |
27.78 - 29.96 |
0.8748 times |
Fri 29 September 2023 |
29.82 (-6.08%) |
31.60 |
29.67 - 31.73 |
0.7131 times |
Thu 31 August 2023 |
31.75 (-0.81%) |
31.87 |
30.91 - 31.90 |
1.6904 times |
Mon 31 July 2023 |
32.01 (2.63%) |
31.11 |
30.54 - 32.13 |
0.9508 times |

DMA SMA EMA moving averages of Pacer Biothreat VIRS
DMA (daily moving average) of Pacer Biothreat VIRS
| DMA period | DMA value | | 5 day DMA | 35.87 | | 12 day DMA | 35.43 | | 20 day DMA | 35.01 | | 35 day DMA | 34.97 | | 50 day DMA | 35.28 | | 100 day DMA | 34.49 | | 150 day DMA | 33.03 | | 200 day DMA | 32.47 | EMA (exponential moving average) of Pacer Biothreat VIRS
| EMA period | EMA current | EMA prev | EMA prev2 | | 5 day EMA | 35.87 | 35.78 | 35.63 | | 12 day EMA | 35.5 | 35.4 | 35.28 | | 20 day EMA | 35.29 | 35.21 | 35.12 | | 35 day EMA | 35.29 | 35.25 | 35.2 | | 50 day EMA | 35.38 | 35.35 | 35.32 |
SMA (simple moving average) of Pacer Biothreat VIRS
| SMA period | SMA current | SMA prev | SMA prev2 | | 5 day SMA | 35.87 | 35.76 | 35.61 | | 12 day SMA | 35.43 | 35.28 | 35.15 | | 20 day SMA | 35.01 | 34.89 | 34.78 | | 35 day SMA | 34.97 | 34.97 | 34.98 | | 50 day SMA | 35.28 | 35.28 | 35.27 | | 100 day SMA | 34.49 | 34.45 | 34.41 | | 150 day SMA | 33.03 | 32.99 | 32.94 | | 200 day SMA | 32.47 | 32.45 | 32.42 |
|
|
