FlexsharesInternational IQDE full analysis,charts,indicators,moving averages,SMA,DMA,EMA,ADX,MACD,RSIFlexshares International IQDE WideScreen charts, DMA,SMA,EMA technical analysis, forecast prediction, by indicators ADX,MACD,RSI,CCI AMEX stock exchange
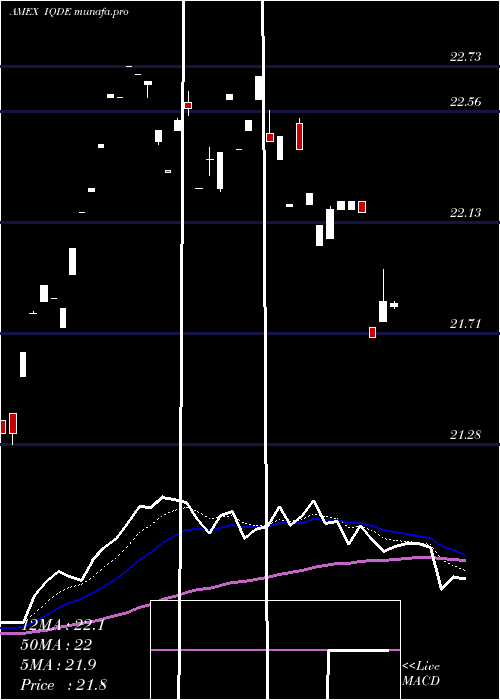
Daily price and charts and targets FlexsharesInternational Strong Daily Stock price targets for FlexsharesInternational IQDE are 22.32 and 22.33 | Daily Target 1 | 22.31 | | Daily Target 2 | 22.32 | | Daily Target 3 | 22.323333333333 | | Daily Target 4 | 22.33 | | Daily Target 5 | 22.33 |
Daily price and volume Flexshares International
| Date |
Closing |
Open |
Range |
Volume |
Thu 23 May 2024 |
22.32 (-0.71%) |
22.33 |
22.32 - 22.33 |
0.3259 times |
Wed 22 May 2024 |
22.48 (-0.84%) |
22.44 |
22.43 - 22.48 |
1.3036 times |
Tue 21 May 2024 |
22.67 (-0.13%) |
22.66 |
22.61 - 22.67 |
6.029 times |
Mon 20 May 2024 |
22.70 (-0.13%) |
22.70 |
22.70 - 22.70 |
0.075 times |
Fri 17 May 2024 |
22.73 (0.53%) |
22.73 |
22.73 - 22.73 |
0 times |
Thu 16 May 2024 |
22.61 (-0.04%) |
22.61 |
22.61 - 22.61 |
0.013 times |
Wed 15 May 2024 |
22.62 (0.85%) |
22.61 |
22.61 - 22.62 |
0.787 times |
Tue 14 May 2024 |
22.43 (0.76%) |
22.42 |
22.42 - 22.43 |
0.6518 times |
Mon 13 May 2024 |
22.26 (0.41%) |
22.25 |
22.25 - 22.26 |
0.6518 times |
Fri 10 May 2024 |
22.17 (0.64%) |
22.17 |
22.17 - 22.17 |
0.1629 times |
Thu 09 May 2024 |
22.03 (1.06%) |
21.93 |
21.93 - 22.03 |
1.3036 times |
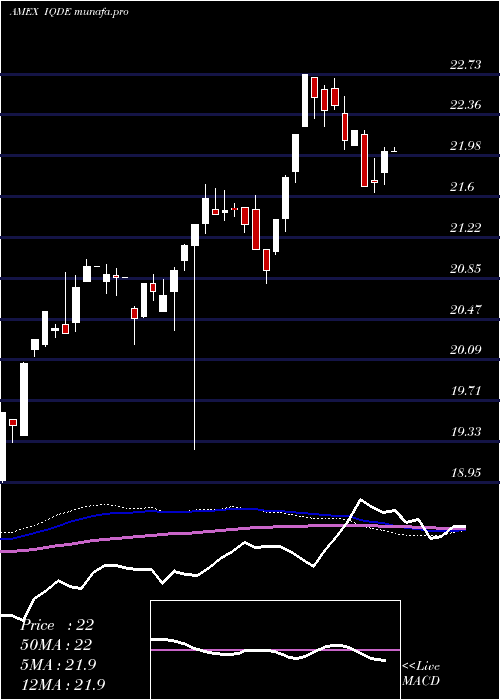
Weekly price and charts FlexsharesInternational Strong weekly Stock price targets for FlexsharesInternational IQDE are 22.13 and 22.51 | Weekly Target 1 | 22.07 | | Weekly Target 2 | 22.19 | | Weekly Target 3 | 22.446666666667 | | Weekly Target 4 | 22.57 | | Weekly Target 5 | 22.83 |
Weekly price and volumes for Flexshares International
| Date |
Closing |
Open |
Range |
Volume |
Thu 23 May 2024 |
22.32 (-1.8%) |
22.70 |
22.32 - 22.70 |
0.6445 times |
Fri 17 May 2024 |
22.73 (2.53%) |
22.25 |
22.25 - 22.73 |
0.1753 times |
Fri 10 May 2024 |
22.17 (1.79%) |
21.83 |
21.73 - 22.17 |
0.6247 times |
Fri 03 May 2024 |
21.78 (1.82%) |
21.40 |
21.28 - 21.79 |
1.1 times |
Fri 26 April 2024 |
21.39 (2.25%) |
21.09 |
21.06 - 21.39 |
0.2988 times |
Fri 19 April 2024 |
20.92 (-0.9%) |
21.11 |
20.79 - 21.11 |
0.8148 times |
Fri 12 April 2024 |
21.11 (-1.08%) |
21.48 |
21.11 - 21.61 |
1.9827 times |
Fri 05 April 2024 |
21.34 (-0.65%) |
21.50 |
21.27 - 21.50 |
3.395 times |
Thu 28 March 2024 |
21.48 (0.05%) |
21.49 |
21.42 - 21.54 |
0.8012 times |
Fri 22 March 2024 |
21.47 (0.19%) |
21.45 |
21.38 - 21.66 |
0.163 times |
Fri 15 March 2024 |
21.43 (-0.7%) |
21.48 |
21.43 - 21.67 |
0.4753 times |
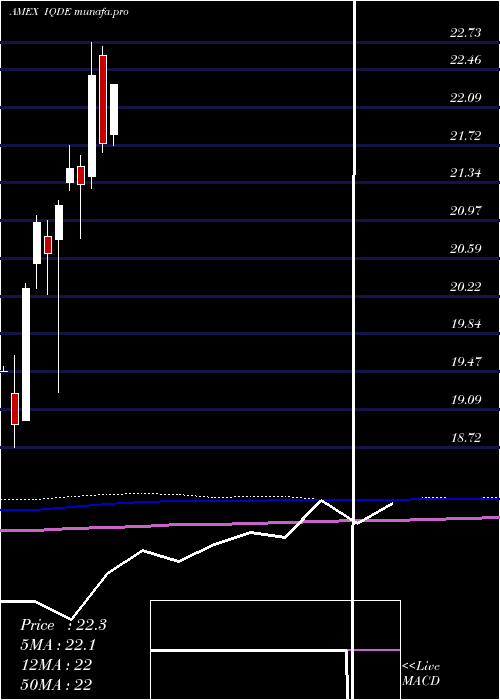
Monthly price and charts FlexsharesInternational Strong monthly Stock price targets for FlexsharesInternational IQDE are 21.8 and 23.25 | Monthly Target 1 | 20.66 | | Monthly Target 2 | 21.49 | | Monthly Target 3 | 22.11 | | Monthly Target 4 | 22.94 | | Monthly Target 5 | 23.56 |
Monthly price and volumes Flexshares International
| Date |
Closing |
Open |
Range |
Volume |
Thu 23 May 2024 |
22.32 (4.69%) |
21.40 |
21.28 - 22.73 |
0.3352 times |
Tue 30 April 2024 |
21.32 (-0.74%) |
21.50 |
20.79 - 21.61 |
1.091 times |
Thu 28 March 2024 |
21.48 (1.7%) |
21.34 |
21.26 - 21.71 |
0.4437 times |
Thu 29 February 2024 |
21.12 (2.33%) |
20.78 |
19.26 - 21.16 |
1.1767 times |
Wed 31 January 2024 |
20.64 (-1.48%) |
20.81 |
20.23 - 20.97 |
0.3301 times |
Fri 29 December 2023 |
20.95 (3.25%) |
20.54 |
20.29 - 21.02 |
2.7415 times |
Thu 30 November 2023 |
20.29 (7.07%) |
18.99 |
18.99 - 20.34 |
1.4252 times |
Tue 31 October 2023 |
18.95 (-2.67%) |
19.25 |
18.72 - 19.63 |
0.2038 times |
Fri 29 September 2023 |
19.47 (-2.8%) |
20.10 |
19.30 - 20.29 |
1.689 times |
Thu 31 August 2023 |
20.03 (-3.89%) |
20.64 |
19.57 - 20.64 |
0.5637 times |
Mon 31 July 2023 |
20.84 (3.78%) |
20.17 |
19.71 - 20.85 |
0.2186 times |
DMA SMA EMA moving averages of Flexshares International IQDE
DMA (daily moving average) of Flexshares International IQDE
| DMA period | DMA value | | 5 day DMA | 22.58 | | 12 day DMA | 22.4 | | 20 day DMA | 22.08 | | 35 day DMA | 21.69 | | 50 day DMA | 21.62 | | 100 day DMA | 21.26 | | 150 day DMA | 20.85 | | 200 day DMA | 20.57 | EMA (exponential moving average) of Flexshares International IQDE
| EMA period | EMA current | EMA prev | EMA prev2 | | 5 day EMA | 22.49 | 22.57 | 22.61 | | 12 day EMA | 22.36 | 22.37 | 22.35 | | 20 day EMA | 22.16 | 22.14 | 22.1 | | 35 day EMA | 21.95 | 21.93 | 21.9 | | 50 day EMA | 21.71 | 21.69 | 21.66 |
SMA (simple moving average) of Flexshares International IQDE
| SMA period | SMA current | SMA prev | SMA prev2 | | 5 day SMA | 22.58 | 22.64 | 22.67 | | 12 day SMA | 22.4 | 22.36 | 22.31 | | 20 day SMA | 22.08 | 22.02 | 21.96 | | 35 day SMA | 21.69 | 21.66 | 21.63 | | 50 day SMA | 21.62 | 21.61 | 21.59 | | 100 day SMA | 21.26 | 21.25 | 21.23 | | 150 day SMA | 20.85 | 20.83 | 20.81 | | 200 day SMA | 20.57 | 20.55 | 20.54 |
|
|
