MadronaInternational FWDI full analysis,charts,indicators,moving averages,SMA,DMA,EMA,ADX,MACD,RSIMadrona International FWDI WideScreen charts, DMA,SMA,EMA technical analysis, forecast prediction, by indicators ADX,MACD,RSI,CCI AMEX stock exchange
Daily price and charts and targets MadronaInternational Strong Daily Stock price targets for MadronaInternational FWDI are 7.68 and 8.66 | Daily Target 1 | 7.47 | | Daily Target 2 | 7.89 | | Daily Target 3 | 8.4466666666667 | | Daily Target 4 | 8.87 | | Daily Target 5 | 9.43 |
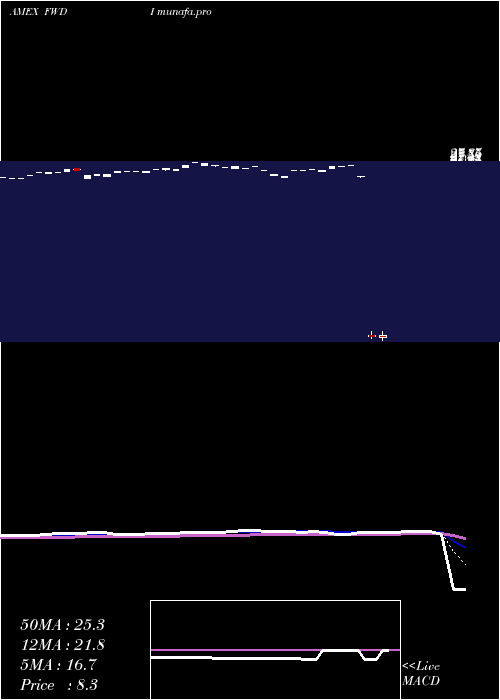
Daily price and volume Madrona International
| Date |
Closing |
Open |
Range |
Volume |
Wed 19 November 2025 |
8.32 (-1.77%) |
8.51 |
8.02 - 9.00 |
2.4058 times |
Tue 18 November 2025 |
8.47 (-67.83%) |
8.51 |
8.24 - 8.96 |
7.5752 times |
Fri 22 March 2019 |
26.33 (-4.43%) |
26.30 |
26.26 - 26.33 |
0.0088 times |
Tue 19 March 2019 |
27.55 (0.29%) |
27.55 |
27.55 - 27.55 |
0.0007 times |
Mon 18 March 2019 |
27.47 (0.29%) |
27.47 |
27.47 - 27.47 |
0.0007 times |
Fri 15 March 2019 |
27.39 (1.33%) |
27.21 |
27.21 - 27.39 |
0.0007 times |
Thu 14 March 2019 |
27.03 (-0.18%) |
26.83 |
26.83 - 27.03 |
0.0073 times |
Wed 13 March 2019 |
27.08 (0.33%) |
27.08 |
27.08 - 27.08 |
0 times |
Tue 12 March 2019 |
26.99 (-0.11%) |
26.99 |
26.99 - 26.99 |
0 times |
Mon 11 March 2019 |
27.02 (2.7%) |
27.02 |
27.02 - 27.02 |
0.0007 times |
Fri 08 March 2019 |
26.31 (-0.68%) |
26.18 |
26.18 - 26.31 |
0.0066 times |
Weekly price and charts MadronaInternational Strong weekly Stock price targets for MadronaInternational FWDI are 7.68 and 8.66 | Weekly Target 1 | 7.47 | | Weekly Target 2 | 7.89 | | Weekly Target 3 | 8.4466666666667 | | Weekly Target 4 | 8.87 | | Weekly Target 5 | 9.43 |
Weekly price and volumes for Madrona International
| Date |
Closing |
Open |
Range |
Volume |
Wed 19 November 2025 |
8.32 (-68.4%) |
8.51 |
8.02 - 9.00 |
9.8655 times |
Fri 22 March 2019 |
26.33 (-3.87%) |
27.47 |
26.26 - 27.55 |
0.0101 times |
Fri 15 March 2019 |
27.39 (4.1%) |
27.02 |
26.83 - 27.39 |
0.0087 times |
Fri 08 March 2019 |
26.31 (-3.98%) |
27.25 |
26.18 - 27.40 |
0.0239 times |
Fri 01 March 2019 |
27.40 (-0.36%) |
27.87 |
27.18 - 27.87 |
0.0319 times |
Fri 22 February 2019 |
27.50 (2.12%) |
27.07 |
26.99 - 27.50 |
0.0163 times |
Fri 15 February 2019 |
26.93 (1.62%) |
26.33 |
26.33 - 26.93 |
0.0217 times |
Fri 08 February 2019 |
26.50 (-1.12%) |
26.73 |
26.10 - 27.11 |
0.013 times |
Fri 01 February 2019 |
26.80 (2.1%) |
26.08 |
26.05 - 26.80 |
0.0043 times |
Fri 25 January 2019 |
26.25 (1.51%) |
25.28 |
25.28 - 26.25 |
0.0043 times |
Fri 18 January 2019 |
25.86 (1.93%) |
24.86 |
24.78 - 25.86 |
0.008 times |

Monthly price and charts MadronaInternational Strong monthly Stock price targets for MadronaInternational FWDI are 7.68 and 8.66 | Monthly Target 1 | 7.47 | | Monthly Target 2 | 7.89 | | Monthly Target 3 | 8.4466666666667 | | Monthly Target 4 | 8.87 | | Monthly Target 5 | 9.43 |
Monthly price and volumes Madrona International
| Date |
Closing |
Open |
Range |
Volume |
Wed 19 November 2025 |
8.32 (-68.4%) |
8.51 |
8.02 - 9.00 |
9.1308 times |
Fri 22 March 2019 |
26.33 (-3.69%) |
27.18 |
26.18 - 27.55 |
0.0557 times |
Thu 28 February 2019 |
27.34 (2.28%) |
26.64 |
26.10 - 27.87 |
0.0634 times |
Thu 31 January 2019 |
26.73 (13.5%) |
23.42 |
23.24 - 26.73 |
0.0362 times |
Mon 31 December 2018 |
23.55 (-8.65%) |
26.65 |
22.89 - 26.65 |
0.1295 times |
Fri 30 November 2018 |
25.78 (-0.69%) |
26.43 |
25.45 - 26.87 |
0.165 times |
Wed 31 October 2018 |
25.96 (-9.1%) |
28.56 |
25.32 - 28.69 |
0.1489 times |
Fri 28 September 2018 |
28.56 (0.53%) |
28.41 |
27.24 - 28.81 |
0.07 times |
Fri 31 August 2018 |
28.41 (-8.41%) |
31.02 |
27.80 - 31.02 |
0.1113 times |
Tue 31 July 2018 |
31.02 (2.95%) |
30.34 |
29.20 - 31.02 |
0.0892 times |
Fri 29 June 2018 |
30.13 (-2.43%) |
30.88 |
30.13 - 31.47 |
0.0771 times |

DMA SMA EMA moving averages of Madrona International FWDI
DMA (daily moving average) of Madrona International FWDI
| DMA period | DMA value | | 5 day DMA | 19.63 | | 12 day DMA | 23.87 | | 20 day DMA | 25.3 | | 35 day DMA | 25.99 | | 50 day DMA | 25.9 | | 100 day DMA | 25.61 | | 150 day DMA | 26.55 | | 200 day DMA | 27.72 | EMA (exponential moving average) of Madrona International FWDI
| EMA period | EMA current | EMA prev | EMA prev2 | | 5 day EMA | 16.65 | 20.82 | 27 | | 12 day EMA | 21.77 | 24.21 | 27.07 | | 20 day EMA | 23.64 | 25.25 | 27.02 | | 35 day EMA | 24.75 | 25.72 | 26.74 | | 50 day EMA | 25.07 | 25.75 | 26.45 |
SMA (simple moving average) of Madrona International FWDI
| SMA period | SMA current | SMA prev | SMA prev2 | | 5 day SMA | 19.63 | 23.44 | 27.15 | | 12 day SMA | 23.87 | 25.43 | 27.01 | | 20 day SMA | 25.3 | 26.26 | 27.2 | | 35 day SMA | 25.99 | 26.51 | 27.03 | | 50 day SMA | 25.9 | 26.23 | 26.56 | | 100 day SMA | 25.61 | 25.79 | 25.98 | | 150 day SMA | 26.55 | 26.7 | 26.85 | | 200 day SMA | 27.72 | 27.83 | 27.95 |
|
|
