FriedmanIndustries FRD full analysis,charts,indicators,moving averages,SMA,DMA,EMA,ADX,MACD,RSIFriedman Industries FRD WideScreen charts, DMA,SMA,EMA technical analysis, forecast prediction, by indicators ADX,MACD,RSI,CCI AMEX stock exchange
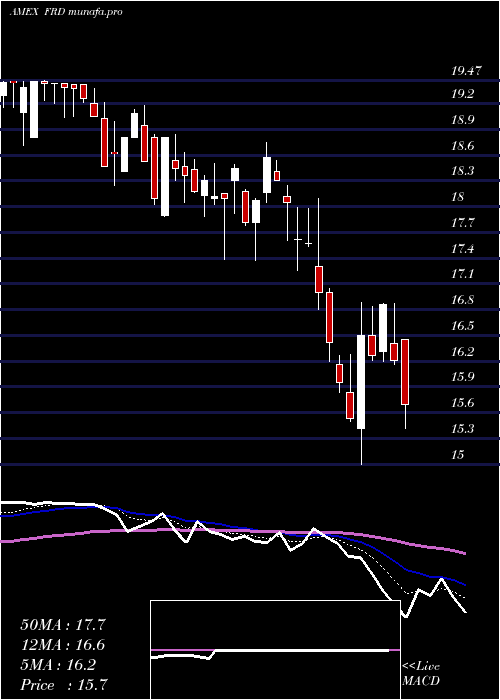
Daily price and charts and targets FriedmanIndustries Strong Daily Stock price targets for FriedmanIndustries FRD are 15.2 and 15.79 | Daily Target 1 | 14.72 | | Daily Target 2 | 15.09 | | Daily Target 3 | 15.306666666667 | | Daily Target 4 | 15.68 | | Daily Target 5 | 15.9 |
Daily price and volume Friedman Industries
| Date |
Closing |
Open |
Range |
Volume |
Wed 12 March 2025 |
15.47 (2.31%) |
15.44 |
14.93 - 15.52 |
1.216 times |
Tue 11 March 2025 |
15.12 (-1.18%) |
15.45 |
15.10 - 15.55 |
0.9369 times |
Mon 10 March 2025 |
15.30 (-1.86%) |
15.40 |
15.23 - 15.67 |
0.8439 times |
Fri 07 March 2025 |
15.59 (-1.27%) |
15.67 |
15.43 - 15.84 |
0.4253 times |
Thu 06 March 2025 |
15.79 (1.22%) |
15.50 |
15.31 - 15.94 |
2.881 times |
Wed 05 March 2025 |
15.60 (0.58%) |
15.64 |
15.50 - 15.87 |
0.7997 times |
Tue 04 March 2025 |
15.51 (-1.84%) |
15.38 |
15.26 - 15.82 |
0.9967 times |
Mon 03 March 2025 |
15.80 (-3.72%) |
16.50 |
15.80 - 16.50 |
0.8771 times |
Fri 28 February 2025 |
16.41 (-2.15%) |
16.60 |
16.41 - 16.80 |
0.5781 times |
Thu 27 February 2025 |
16.77 (-0.47%) |
16.51 |
16.14 - 16.86 |
0.4452 times |
Wed 26 February 2025 |
16.85 (1.02%) |
16.75 |
15.94 - 16.85 |
2.0533 times |
Weekly price and charts FriedmanIndustries Strong weekly Stock price targets for FriedmanIndustries FRD are 15.2 and 15.94 | Weekly Target 1 | 14.62 | | Weekly Target 2 | 15.04 | | Weekly Target 3 | 15.356666666667 | | Weekly Target 4 | 15.78 | | Weekly Target 5 | 16.1 |
Weekly price and volumes for Friedman Industries
| Date |
Closing |
Open |
Range |
Volume |
Wed 12 March 2025 |
15.47 (-0.77%) |
15.40 |
14.93 - 15.67 |
0.6399 times |
Fri 07 March 2025 |
15.59 (-5%) |
16.50 |
15.26 - 16.50 |
1.2768 times |
Fri 28 February 2025 |
16.41 (-2.44%) |
16.83 |
15.07 - 16.86 |
1.0627 times |
Fri 21 February 2025 |
16.82 (-3.89%) |
17.31 |
16.51 - 17.59 |
0.6115 times |
Fri 14 February 2025 |
17.50 (3.24%) |
15.39 |
15.39 - 17.80 |
1.7764 times |
Fri 07 February 2025 |
16.95 (11.73%) |
14.95 |
14.85 - 17.05 |
1.0258 times |
Fri 31 January 2025 |
15.17 (6.31%) |
14.00 |
13.94 - 15.24 |
1.3678 times |
Fri 24 January 2025 |
14.27 (2.29%) |
14.10 |
13.93 - 14.96 |
0.9166 times |
Fri 17 January 2025 |
13.95 (0%) |
14.00 |
13.95 - 14.16 |
0.2965 times |
Fri 17 January 2025 |
13.95 (-6.12%) |
14.25 |
13.95 - 14.98 |
1.0258 times |
Fri 10 January 2025 |
14.86 (-1%) |
15.07 |
14.58 - 15.07 |
0.1405 times |
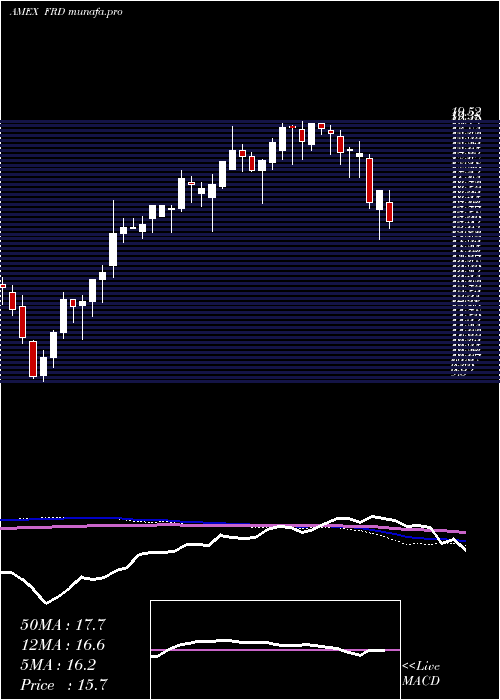
Monthly price and charts FriedmanIndustries Strong monthly Stock price targets for FriedmanIndustries FRD are 14.42 and 15.99 | Monthly Target 1 | 14.06 | | Monthly Target 2 | 14.77 | | Monthly Target 3 | 15.633333333333 | | Monthly Target 4 | 16.34 | | Monthly Target 5 | 17.2 |
Monthly price and volumes Friedman Industries
| Date |
Closing |
Open |
Range |
Volume |
Wed 12 March 2025 |
15.47 (-5.73%) |
16.50 |
14.93 - 16.50 |
0.45 times |
Fri 28 February 2025 |
16.41 (8.17%) |
14.95 |
14.85 - 17.80 |
1.0509 times |
Fri 31 January 2025 |
15.17 (-0.78%) |
15.52 |
13.93 - 15.75 |
1.0159 times |
Tue 31 December 2024 |
15.29 (1.26%) |
16.71 |
14.91 - 18.01 |
0.4715 times |
Tue 26 November 2024 |
15.10 (8.24%) |
14.14 |
13.40 - 16.00 |
0.6519 times |
Thu 31 October 2024 |
13.95 (-12.92%) |
15.67 |
13.86 - 16.74 |
0.7721 times |
Mon 30 September 2024 |
16.02 (6.45%) |
14.90 |
13.71 - 16.45 |
0.9367 times |
Fri 30 August 2024 |
15.05 (-10.95%) |
16.64 |
14.24 - 17.30 |
1.4014 times |
Wed 31 July 2024 |
16.90 (11.92%) |
15.12 |
14.01 - 19.12 |
1.6317 times |
Fri 28 June 2024 |
15.10 (-17.49%) |
18.12 |
13.78 - 18.25 |
1.6179 times |
Fri 31 May 2024 |
18.30 (-5.82%) |
19.43 |
17.37 - 19.43 |
0.8135 times |

DMA SMA EMA moving averages of Friedman Industries FRD
DMA (daily moving average) of Friedman Industries FRD
| DMA period | DMA value | | 5 day DMA | 15.45 | | 12 day DMA | 15.91 | | 20 day DMA | 16.24 | | 35 day DMA | 15.85 | | 50 day DMA | 15.49 | | 100 day DMA | 15.25 | | 150 day DMA | 15.24 | | 200 day DMA | 15.54 | EMA (exponential moving average) of Friedman Industries FRD
| EMA period | EMA current | EMA prev | EMA prev2 | | 5 day EMA | 15.46 | 15.45 | 15.61 | | 12 day EMA | 15.76 | 15.81 | 15.93 | | 20 day EMA | 15.88 | 15.92 | 16 | | 35 day EMA | 15.74 | 15.76 | 15.8 | | 50 day EMA | 15.49 | 15.49 | 15.51 |
SMA (simple moving average) of Friedman Industries FRD
| SMA period | SMA current | SMA prev | SMA prev2 | | 5 day SMA | 15.45 | 15.48 | 15.56 | | 12 day SMA | 15.91 | 15.88 | 16.02 | | 20 day SMA | 16.24 | 16.33 | 16.41 | | 35 day SMA | 15.85 | 15.82 | 15.79 | | 50 day SMA | 15.49 | 15.48 | 15.49 | | 100 day SMA | 15.25 | 15.25 | 15.26 | | 150 day SMA | 15.24 | 15.25 | 15.27 | | 200 day SMA | 15.54 | 15.55 | 15.56 |
|
|
