LeadersharesActivist ACTV full analysis,charts,indicators,moving averages,SMA,DMA,EMA,ADX,MACD,RSILeadershares Activist ACTV WideScreen charts, DMA,SMA,EMA technical analysis, forecast prediction, by indicators ADX,MACD,RSI,CCI AMEX stock exchange
Daily price and charts and targets LeadersharesActivist Strong Daily Stock price targets for LeadersharesActivist ACTV are 32.7 and 32.7 | Daily Target 1 | 32.7 | | Daily Target 2 | 32.7 | | Daily Target 3 | 32.7 | | Daily Target 4 | 32.7 | | Daily Target 5 | 32.7 |
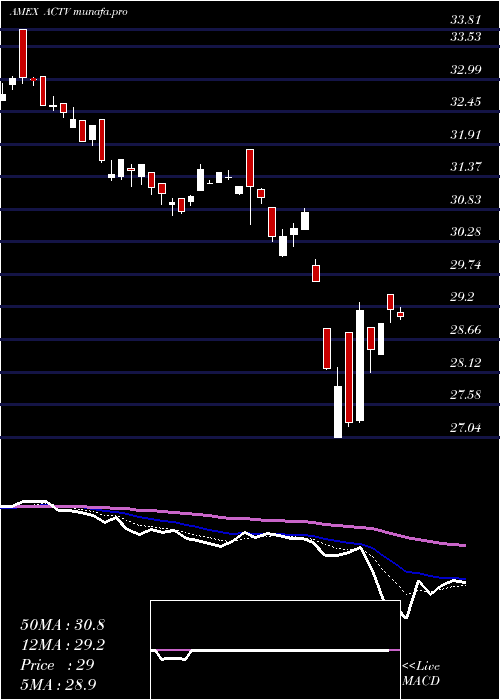
Daily price and volume Leadershares Activist
| Date |
Closing |
Open |
Range |
Volume |
Tue 02 September 2025 |
32.70 (-0.85%) |
32.70 |
32.70 - 32.70 |
0.1786 times |
Fri 29 August 2025 |
32.98 (0%) |
32.94 |
32.94 - 32.98 |
0.2976 times |
Fri 29 August 2025 |
32.98 (-0.39%) |
32.94 |
32.94 - 32.98 |
0.2976 times |
Thu 28 August 2025 |
33.11 (0.7%) |
32.97 |
32.95 - 33.11 |
1.6667 times |
Wed 27 August 2025 |
32.88 (-0.06%) |
32.80 |
32.80 - 32.98 |
1.6667 times |
Tue 26 August 2025 |
32.90 (0.15%) |
32.85 |
32.74 - 32.90 |
2.1429 times |
Mon 25 August 2025 |
32.85 (-0.18%) |
32.92 |
32.85 - 32.92 |
0.2976 times |
Fri 22 August 2025 |
32.91 (1.39%) |
32.86 |
32.85 - 32.91 |
0.1786 times |
Thu 21 August 2025 |
32.46 (-0.12%) |
32.53 |
32.38 - 32.53 |
2.381 times |
Wed 20 August 2025 |
32.50 (-0.73%) |
32.70 |
32.41 - 32.70 |
0.8929 times |
Tue 19 August 2025 |
32.74 (-0.43%) |
32.82 |
32.71 - 32.82 |
0.5952 times |
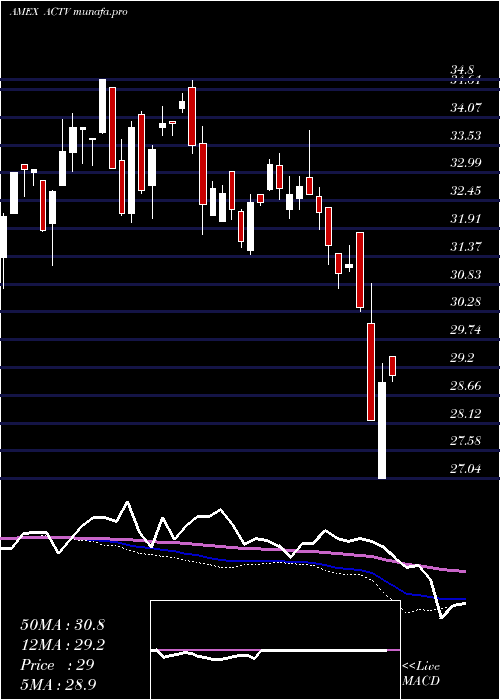
Weekly price and charts LeadersharesActivist Strong weekly Stock price targets for LeadersharesActivist ACTV are 32.7 and 32.7 | Weekly Target 1 | 32.7 | | Weekly Target 2 | 32.7 | | Weekly Target 3 | 32.7 | | Weekly Target 4 | 32.7 | | Weekly Target 5 | 32.7 |
Weekly price and volumes for Leadershares Activist
| Date |
Closing |
Open |
Range |
Volume |
Tue 02 September 2025 |
32.70 (-0.85%) |
32.70 |
32.70 - 32.70 |
0.011 times |
Fri 29 August 2025 |
32.98 (0%) |
32.94 |
32.94 - 32.98 |
0.0184 times |
Fri 29 August 2025 |
32.98 (0.21%) |
32.92 |
32.74 - 33.11 |
0.3755 times |
Fri 22 August 2025 |
32.91 (0.18%) |
32.85 |
32.38 - 32.91 |
0.3092 times |
Fri 15 August 2025 |
32.85 (1.67%) |
32.33 |
32.14 - 32.92 |
0.265 times |
Fri 08 August 2025 |
32.31 (1.35%) |
32.14 |
32.03 - 32.41 |
0.162 times |
Fri 01 August 2025 |
31.88 (-2.66%) |
32.75 |
31.72 - 32.75 |
3.8503 times |
Fri 25 July 2025 |
32.75 (2.18%) |
32.08 |
32.08 - 32.75 |
3.5595 times |
Fri 18 July 2025 |
32.05 (0.19%) |
31.94 |
31.60 - 32.18 |
1.0809 times |
Fri 11 July 2025 |
31.99 (-0.53%) |
31.76 |
31.63 - 32.23 |
0.3681 times |
Thu 03 July 2025 |
32.16 (2%) |
31.57 |
31.51 - 32.16 |
0.2429 times |
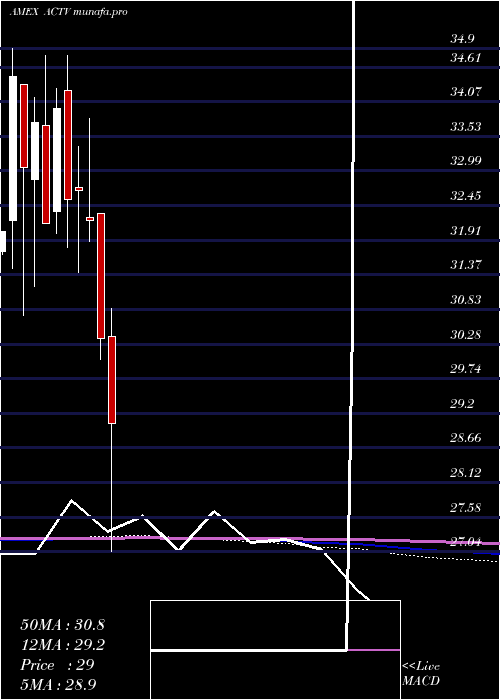
Monthly price and charts LeadersharesActivist Strong monthly Stock price targets for LeadersharesActivist ACTV are 32.7 and 32.7 | Monthly Target 1 | 32.7 | | Monthly Target 2 | 32.7 | | Monthly Target 3 | 32.7 | | Monthly Target 4 | 32.7 | | Monthly Target 5 | 32.7 |
Monthly price and volumes Leadershares Activist
| Date |
Closing |
Open |
Range |
Volume |
Tue 02 September 2025 |
32.70 (-0.85%) |
32.70 |
32.70 - 32.70 |
0.0012 times |
Fri 29 August 2025 |
32.98 (2.61%) |
31.84 |
31.72 - 33.11 |
0.1731 times |
Thu 31 July 2025 |
32.14 (1.64%) |
31.51 |
31.51 - 32.75 |
0.9163 times |
Mon 30 June 2025 |
31.62 (2.93%) |
30.61 |
30.61 - 31.62 |
0.2364 times |
Fri 30 May 2025 |
30.72 (3.05%) |
29.96 |
29.73 - 30.88 |
0.3828 times |
Wed 30 April 2025 |
29.81 (-1.84%) |
30.41 |
27.04 - 30.84 |
2.1412 times |
Mon 31 March 2025 |
30.37 (-5.74%) |
32.32 |
30.04 - 32.32 |
4.498 times |
Fri 28 February 2025 |
32.22 (-1.44%) |
32.27 |
31.89 - 33.81 |
0.4456 times |
Fri 31 January 2025 |
32.69 (0.43%) |
32.73 |
31.41 - 33.37 |
0.5793 times |
Tue 31 December 2024 |
32.55 (-4.15%) |
34.24 |
31.80 - 34.79 |
0.626 times |
Tue 26 November 2024 |
33.96 (5.6%) |
32.36 |
32.02 - 34.28 |
0.8928 times |
DMA SMA EMA moving averages of Leadershares Activist ACTV
DMA (daily moving average) of Leadershares Activist ACTV
| DMA period | DMA value | | 5 day DMA | 32.93 | | 12 day DMA | 32.82 | | 20 day DMA | 32.71 | | 35 day DMA | 32.51 | | 50 day DMA | 32.28 | | 100 day DMA | 31.19 | | 150 day DMA | 31.29 | | 200 day DMA | 31.71 | EMA (exponential moving average) of Leadershares Activist ACTV
| EMA period | EMA current | EMA prev | EMA prev2 | | 5 day EMA | 32.87 | 32.95 | 32.94 | | 12 day EMA | 32.82 | 32.84 | 32.81 | | 20 day EMA | 32.71 | 32.71 | 32.68 | | 35 day EMA | 32.46 | 32.45 | 32.42 | | 50 day EMA | 32.24 | 32.22 | 32.19 |
SMA (simple moving average) of Leadershares Activist ACTV
| SMA period | SMA current | SMA prev | SMA prev2 | | 5 day SMA | 32.93 | 32.97 | 32.94 | | 12 day SMA | 32.82 | 32.84 | 32.83 | | 20 day SMA | 32.71 | 32.68 | 32.63 | | 35 day SMA | 32.51 | 32.49 | 32.47 | | 50 day SMA | 32.28 | 32.25 | 32.21 | | 100 day SMA | 31.19 | 31.15 | 31.11 | | 150 day SMA | 31.29 | 31.3 | 31.3 | | 200 day SMA | 31.71 | 31.72 | 31.72 |
|
|
