GlobalSources GSOL full analysis,charts,indicators,moving averages,SMA,DMA,EMA,ADX,MACD,RSIGlobal Sources GSOL WideScreen charts, DMA,SMA,EMA technical analysis, forecast prediction, by indicators ADX,MACD,RSI,CCI NASDAQ stock exchange
operates under Consumer Services sector & deals in Advertising
Daily price and charts and targets GlobalSources Strong Daily Stock price targets for GlobalSources GSOL are 13.57 and 13.98 | Daily Target 1 | 13.24 | | Daily Target 2 | 13.48 | | Daily Target 3 | 13.646666666667 | | Daily Target 4 | 13.89 | | Daily Target 5 | 14.06 |
Daily price and volume Global Sources
| Date |
Closing |
Open |
Range |
Volume |
Fri 31 October 2025 |
13.73 (5.7%) |
13.59 |
13.40 - 13.81 |
2.7476 times |
Thu 30 October 2025 |
12.99 (-7.15%) |
13.66 |
12.99 - 13.66 |
3.2956 times |
Wed 29 October 2025 |
13.99 (-30.05%) |
14.67 |
13.79 - 14.67 |
2.258 times |
Mon 28 August 2017 |
20.00 (1.01%) |
19.80 |
19.75 - 20.00 |
0.6514 times |
Fri 25 August 2017 |
19.80 (-0.25%) |
19.85 |
19.75 - 19.85 |
0.0188 times |
Thu 24 August 2017 |
19.85 (0.25%) |
19.80 |
19.60 - 19.85 |
0.1277 times |
Wed 23 August 2017 |
19.80 (-0.25%) |
19.75 |
19.75 - 19.80 |
0.1855 times |
Tue 22 August 2017 |
19.85 (0.25%) |
19.80 |
19.80 - 19.85 |
0.0471 times |
Mon 21 August 2017 |
19.80 (0%) |
19.80 |
19.75 - 19.85 |
0.3879 times |
Fri 18 August 2017 |
19.80 (1.02%) |
19.45 |
19.45 - 19.85 |
0.2803 times |
Thu 17 August 2017 |
19.60 (0%) |
19.60 |
19.50 - 19.70 |
0.798 times |
Weekly price and charts GlobalSources Strong weekly Stock price targets for GlobalSources GSOL are 9.86 and 16.87 | Weekly Target 1 | 8.56 | | Weekly Target 2 | 11.15 | | Weekly Target 3 | 15.573333333333 | | Weekly Target 4 | 18.16 | | Weekly Target 5 | 22.58 |
Weekly price and volumes for Global Sources
| Date |
Closing |
Open |
Range |
Volume |
Fri 31 October 2025 |
13.73 (-30.66%) |
19.80 |
12.99 - 20.00 |
4.4195 times |
Fri 25 August 2017 |
19.80 (0%) |
19.80 |
19.60 - 19.85 |
0.3786 times |
Fri 18 August 2017 |
19.80 (3.66%) |
19.15 |
19.05 - 19.85 |
0.8489 times |
Fri 11 August 2017 |
19.10 (-1.55%) |
19.35 |
19.00 - 19.55 |
0.3431 times |
Fri 04 August 2017 |
19.40 (-1.02%) |
19.60 |
19.15 - 19.70 |
0.449 times |
Fri 28 July 2017 |
19.60 (-1.01%) |
19.75 |
19.55 - 19.90 |
0.9869 times |
Fri 21 July 2017 |
19.80 (-0.5%) |
19.85 |
19.75 - 19.95 |
0.532 times |
Fri 14 July 2017 |
19.90 (0.76%) |
19.70 |
19.60 - 19.90 |
0.5549 times |
Fri 07 July 2017 |
19.75 (-1.25%) |
19.85 |
19.50 - 20.00 |
0.8004 times |
Fri 30 June 2017 |
20.00 (-1.72%) |
20.30 |
19.90 - 20.30 |
0.6866 times |
Fri 23 June 2017 |
20.35 (0.99%) |
20.05 |
19.81 - 20.45 |
1.3457 times |

Monthly price and charts GlobalSources Strong monthly Stock price targets for GlobalSources GSOL are 12.52 and 14.2 | Monthly Target 1 | 12.12 | | Monthly Target 2 | 12.92 | | Monthly Target 3 | 13.796666666667 | | Monthly Target 4 | 14.6 | | Monthly Target 5 | 15.48 |
Monthly price and volumes Global Sources
| Date |
Closing |
Open |
Range |
Volume |
Fri 31 October 2025 |
13.73 (-31.35%) |
14.67 |
12.99 - 14.67 |
1.7432 times |
Mon 28 August 2017 |
20.00 (2.04%) |
19.70 |
19.00 - 20.00 |
0.9605 times |
Mon 31 July 2017 |
19.60 (-2%) |
19.85 |
19.50 - 20.00 |
1.258 times |
Fri 30 June 2017 |
20.00 (-4.31%) |
20.75 |
19.81 - 20.90 |
1.4301 times |
Wed 31 May 2017 |
20.90 (127.17%) |
9.20 |
9.20 - 21.80 |
2.5597 times |
Fri 28 April 2017 |
9.20 (11.52%) |
8.25 |
8.15 - 9.20 |
0.3836 times |
Fri 31 March 2017 |
8.25 (-5.71%) |
8.80 |
7.85 - 9.00 |
0.5472 times |
Tue 28 February 2017 |
8.75 (-4.89%) |
9.20 |
8.75 - 9.29 |
0.2191 times |
Tue 31 January 2017 |
9.20 (3.95%) |
8.80 |
8.20 - 9.25 |
0.5091 times |
Fri 30 December 2016 |
8.85 (-1.67%) |
8.95 |
8.20 - 9.27 |
0.3894 times |
Wed 30 November 2016 |
9.00 (11.11%) |
8.10 |
7.84 - 9.30 |
0.3884 times |

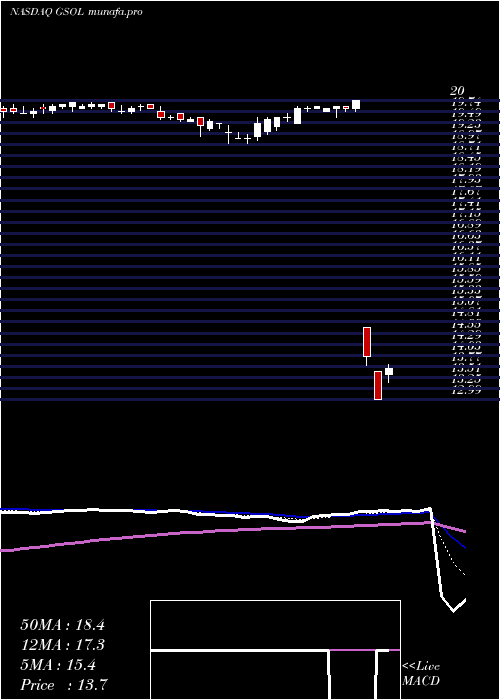
DMA SMA EMA moving averages of Global Sources GSOL
DMA (daily moving average) of Global Sources GSOL
| DMA period | DMA value | | 5 day DMA | 16.1 | | 12 day DMA | 18.23 | | 20 day DMA | 18.68 | | 35 day DMA | 19.15 | | 50 day DMA | 19.39 | | 100 day DMA | 16.73 | | 150 day DMA | 14.09 | | 200 day DMA | 12.78 | EMA (exponential moving average) of Global Sources GSOL
| EMA period | EMA current | EMA prev | EMA prev2 | | 5 day EMA | 15.42 | 16.26 | 17.9 | | 12 day EMA | 17.31 | 17.96 | 18.86 | | 20 day EMA | 18.1 | 18.56 | 19.15 | | 35 day EMA | 18.77 | 19.07 | 19.43 | | 50 day EMA | 19.09 | 19.31 | 19.57 |
SMA (simple moving average) of Global Sources GSOL
| SMA period | SMA current | SMA prev | SMA prev2 | | 5 day SMA | 16.1 | 17.33 | 18.69 | | 12 day SMA | 18.23 | 18.72 | 19.26 | | 20 day SMA | 18.68 | 18.97 | 19.3 | | 35 day SMA | 19.15 | 19.32 | 19.52 | | 50 day SMA | 19.39 | 19.51 | 19.66 | | 100 day SMA | 16.73 | 16.68 | 16.64 | | 150 day SMA | 14.09 | 14.06 | 14.03 | | 200 day SMA | 12.78 | 12.76 | 12.74 |
|
|
